. 2012 Jan;86(2):854-64.
doi: 10.1128/JVI.06097-11. Epub 2011 Nov 16.

Significant association of multiple human cytomegalovirus genomic Loci with glioblastoma multiforme samples

Affiliations

Significant association of multiple human cytomegalovirus genomic Loci with glioblastoma multiforme samples

Padhma Ranganathan et al. J Virol. 2012 Jan.

Abstract

Viruses are appreciated as etiological agents of certain human tumors, but the number of different cancer types induced or exacerbated by viral infections is unknown. Glioblastoma multiforme (GBM)/astrocytoma grade IV is a malignant and lethal brain cancer of unknown origin. Over the past decade, several studies have searched for the presence of a prominent herpesvirus, human cytomegalovirus (HCMV), in GBM samples. While some have detected HCMV DNA, RNA, and proteins in GBM tissues, others have not. Therefore, any purported association of HCMV with GBM remains controversial. In most of the previous studies, only one or a select few viral targets were analyzed. Thus, it remains unclear the extent to which the entire viral genome was present when detected. Here we report the results of a survey of GBM specimens for as many as 20 different regions of the HCMV genome. Our findings indicate that multiple HCMV loci are statistically more likely to be found in GBM samples than in other brain tumors or epileptic brain specimens and that the viral genome was more often detected in frozen samples than in paraffin-embedded archival tissue samples. Finally, our experimental results indicate that cellular genomes substantially outnumber viral genomes in HCMV-positive GBM specimens, likely indicating that only a minority of the cells found in such samples harbor viral DNA. These data argue for the association of HCMV with GBM, defining the virus as oncoaccessory. Furthermore, they imply that, were HCMV to enhance the growth or survival of a tumor (i.e., if it is oncomodulatory), it would likely do so through mechanisms distinct from classic tumor viruses that express transforming viral oncoproteins in the overwhelming majority of tumor cells.


Figures

Fig 1
Fig 1
Comparison of Q-PCR and conventional PCR for the detection of an HCMV genomic sequence. (A) Quantitative real-time PCR detection of the HCMV UL123 (IE1) genomic locus from human fibroblasts infected at MOIs of 0.1, 0.01, 0.001, and 0.0001 for 18 h. (B) Linear plot of threshold values from panel A. (C) Agarose gel detection of the HCMV UL123 (IE1) genomic locus amplified by conventional PCR using the same primers and templates as in panel A. (D) Linear plot of Image J quantification of the gel shown in panel C.
Fig 2
Fig 2
HCMV genomic regions surveyed. Schematic representation of the genomic loci amplified by the PCR primers used in this study. Primer pair locations are approximate, and sizes are not drawn to scale. TR, terminal repeats; UL, unique long; IR, internal repeat; US, unique short. Numbers indicate the specific gene (e.g., UL82) amplified by the indicated primer pair.
Fig 3
Fig 3
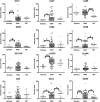
Mann-Whitney U/Wilcoxon rank sum test of paraffin-embedded samples. DNAs from tissue samples were used as templates for conventional PCR amplification with primers detecting the indicated HCMV genomic locus. Bands on agarose gels were quantitated by Image J software, and arbitrary units are plotted. Samples from individual classes (epilepsy, GBM, and other brain tumors [OBT]) were compared with the Mann-Whitney U/Wilcoxon rank sum test. Statistically significant differences are indicated with asterisks as follows: ***, P value < 0.0001; *, P < 0.05.
Fig 4
Fig 4
False discovery rate analysis. P values (Table 2) were converted to Q values to account for the multiple comparisons performed. The negative log of the Q value for each primer pair is plotted for two comparisons, GBM versus epilepsy and GBM versus OBT. Lines are drawn at P values of 0.05 and 0.001. Values between the lines are considered to represent significant differences between the compared cohorts. Values above both lines are considered highly significant. A schematic diagram of the viral genome labeled with the genomic loci surveyed is shown for illustrative purposes (not to scale).
Fig 5
Fig 5
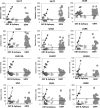
y-intercept analysis of individual paraffin-embedded samples. PCR data from GBM (gray squares), epilepsy (black triangles), meningioma (crosses), schwannoma (large gray asterisks), and oligodendroglioma (gray circles) samples (Fig. 3) are plotted along with values from positive-control samples (black diamonds) that consisted of human fibroblasts infected with HCMV at MOIs of 0.01, 0.001, 0.0001, and 0.00001. Linear regression analysis with the positive-control samples allowed for extrapolation to the y-axis intercept, denoted as a horizontal line.
Fig 6
Fig 6
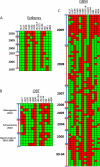
Heat map representation of HCMV-positive and HCMV-negative PCRs from paraffin-embedded samples. HCMV genomic loci are indicated across the top of the heat maps. Unique samples (including the year in which they were collected) are displayed on individual rows. (A) Brain samples from patients with epilepsy with values greater than the y-intercept value (Fig. 5) for each individual PCR are considered positive and denoted as a red square. Values equal to or less than the y-intercept value are considered negative and denoted as a green square. (B and C) OBT samples (B) and GBM samples (C) are displayed as in panel A.
Fig 7
Fig 7
False discovery rate analysis of recently collected paraffin-embedded samples. P values from Mann-Whitney U/Wilcoxon rank sum tests performed only on samples collected after 2007 were converted to Q values to account for the multiple comparisons performed. The negative log of the Q value for each primer pair is plotted for two comparisons, GBM versus epilepsy and GBM versus OBT. Lines are drawn at P values of 0.05 and 0.001. Values between the lines are considered to represent significant differences between the compared cohorts. Values above both lines are considered highly significant. A schematic diagram of the viral genome labeled with the genomic loci surveyed is shown below the graph for illustrative purposes (not to scale).
Fig 8
Fig 8
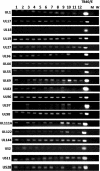
PCR analysis of frozen GBM tumors. DNA extracted from 12 individual frozen GBM tumors (lanes 1 to 12) was analyzed by PCR with primers detecting the indicated HCMV genomic locus. Reaction products were separated by agarose gel electrophoresis and visualized with ethidium bromide staining. DNA extracted from mock-infected (M) or HCMV-infected (MOI of 0.1) human fibroblasts (HCMV strain TB40/E), as well as water (W) served as template controls.
Fig 9
Fig 9
Heat map representation of HCMV-positive and -negative PCRs from frozen GBMs. Amplified bands (Fig. 8) were quantitated with Image J software. Values greater than twice the water control for each individual PCR are considered positive and denoted as a red square. Values equal to or less than twice the water control are considered negative and denoted as a green square. Genomic loci are listed across the top of the heat map, and unique samples are found on each individual row along with their year of collection.
Fig 10
Fig 10
Long-range PCR. Randomly selected DNA templates prepared from the indicated GBM and control samples (from Fig. 8) were amplified with primers that span the UL17 to UL19 loci. Reaction products were visualized by agarose-ethidium bromide gel electrophoresis. HFF, human foreskin fibroblasts.
Fig 11
Fig 11
Q-PCR calculation of viral DNA levels. Randomly selected DNA templates prepared from the indicated GBM and control samples (from Fig. 8) were analyzed by quantitative real-time PCR for the viral UL123 (IE1) locus and cellular actin. The amount of actin DNA compared to the amount of viral DNA in each sample is presented. Error bars represent the standard errors of the means.

References

    1. Benjamini Y, Hochberg Y. 1995. Controlling the false discovery rate - a practical and powerful approach to multiple testing. J. R. Stat. Soc. Ser. B 57:289–300
    1. Britt W. 2008. Manifestations of human cytomegalovirus infection: proposed mechanisms of acute and chronic disease. Curr. Top. Microbiol. Immunol. 325:417–470 - PubMed
    1. Brune W. 2011. Inhibition of programmed cell death by cytomegaloviruses. Virus Res. 157:144–150 - PubMed
    1. Caposio P, Orloff SL, Streblow DN. 2011. The role of cytomegalovirus in angiogenesis. Virus Res. 157:204–211 - PMC - PubMed
    1. Cobbs CS, et al. 2002. Human cytomegalovirus infection and expression in human malignant glioma. Cancer Res. 62:3347–3350 - PubMed

Publication types

MeSH terms