. 2011 Nov 16;31(46):16770-80.
doi: 10.1523/JNEUROSCI.3384-11.2011.

Use dependence of presynaptic tenacity

Affiliations

Use dependence of presynaptic tenacity

Arava Fisher-Lavie et al. J Neurosci. .

Abstract

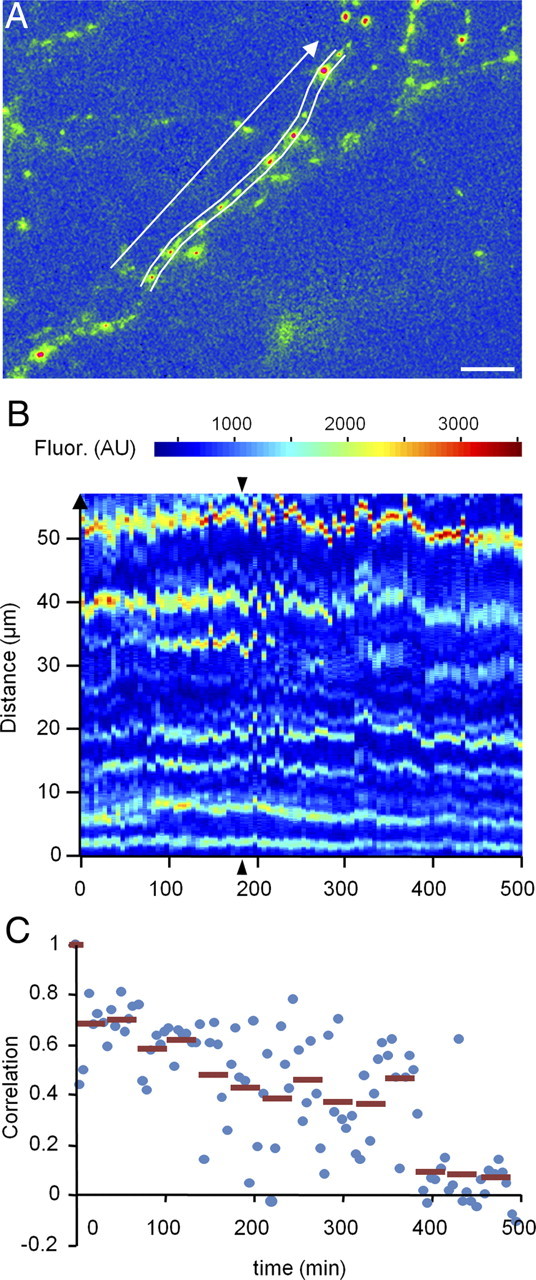
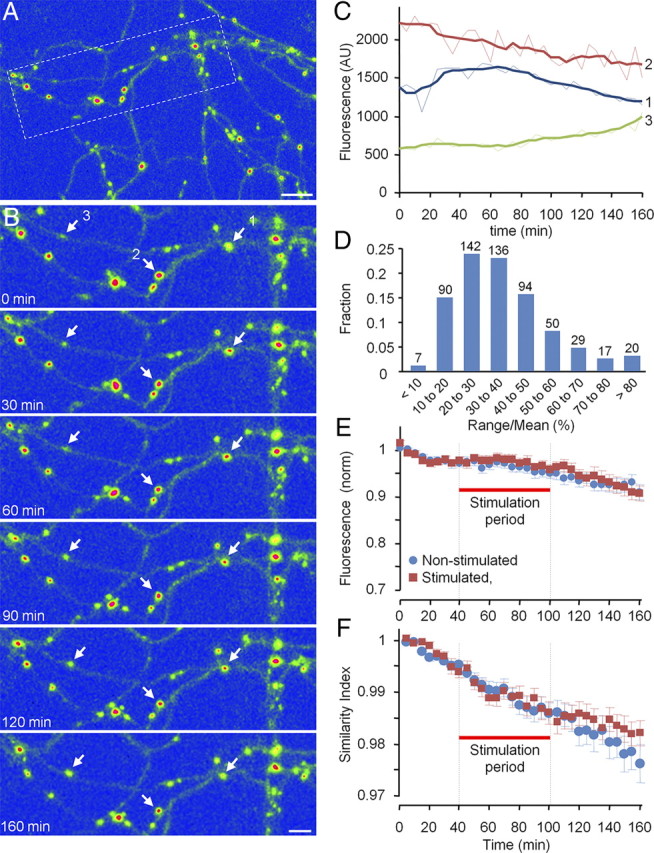
Recent studies indicate that synaptic vesicles (SVs) are continuously interchanged among nearby synapses at very significant rates. These dynamics and the lack of obvious barriers confining synaptic vesicles to specific synapses would seem to challenge the ability of synapses to maintain a constant amount of synaptic vesicles over prolonged time scales. Moreover, the extensive mobilization of synaptic vesicles associated with presynaptic activity might be expected to intensify this challenge. Here we examined the ability of individual presynaptic boutons of rat hippocampal neurons to maintain their synaptic vesicle content, and the degree to which this ability is affected by continuous activity. We found that the synaptic vesicle content of individual boutons belonging to the same axons gradually changed over several hours, and that these changes occurred independently of activity. Intermittent stimulation for 1 h accelerated rates of vesicle pool size change. Interestingly, however, following stimulation cessation, vesicle pool size change rates gradually converged with basal change rates. Over similar time scales, active zones (AZs) exhibited substantial remodeling; yet, unlike synaptic vesicles, AZ remodeling was not affected by the stimulation paradigms used here. These findings indicate that enhanced activity levels can increase synaptic vesicle redistribution among nearby synapses, but also highlight the presence of forces that act to restore particular set points in terms of SV contents, and support a role for active zones in preserving such set points. These findings also indicate, however, that neither AZ size nor SV content set points are particularly stable, questioning the long-term tenacity of presynaptic specializations.


Figures

Figure 1.
Figure 1.
Expression of EGFP:SV2A in cultured hippocampal neurons. A, A fluorescence image of an axon belonging to a neuron expressing EGFP:SV2A. B, A higher magnification of the same region shown in A at the end of a ∼20 h time-lapse session. C, Same region as in B after labeling with FM4-64 by field stimulation for 1 min at 10 Hz. Note the good spatial correspondence between EGFP:SV2A and FM4-64-labeled puncta (yellow arrows). D, Same region as in B after unloading the FM4-64 (2 min at 10 Hz). E, Correlation between EGFP:SV2A fluorescence and FM4-64 fluorescence for the same region. Scale bars, 10 μm.
Figure 2.
Figure 2.
Long-term changes in EGFP:SV2A fluorescence. A, An axon belonging to a neuron expressing EGFP:SV2A. Fluorescence levels are encoded in false color according to color scale at bottom of the panel. Scale bar, 10 μm. B, Time-lapse image of region enclosed in rectangle in A. Images were collected at 5 min intervals (only a subset of these shown here) for ∼500 min. Scale bar, 5 μm. C, Changes in fluorescence over time for three boutons pointed to by arrows in B, stars in A. Raw measurements depicted by thin lines; smoothed (7-point low-pass filter) depicted as thick lines. D, Illustration of the range/mean (normalized range) measure calculated here for bouton 1 in A–C. E, Distribution of normalized range values for all boutons in this experiment (5 fields of view, 89 boutons). F, Measures of changes in relative sizes of SV pools. Two measures were calculated for all boutons enclosed in rectangles/stars in A: relative remodeling (Minerbi et al., 2009; blue) and SI (Sasaki et al., 2007; red). Note the gradual and symmetrical decay of both measures. G, SI decay rates for all five cells followed in this experiment. The thick black line is the average SI decay rate. The line pointed to by arrows is the same data shown in F.
Figure 3.
Figure 3.
A, Kymograph analysis of the same axonal segment as in Figure 2A. Lines depict the region used to obtain the fluorescence profile along this axon. Arrow shows direction of profile vector. t = 180 min. B, Changes in fluorescence profiles over time. Fluorescence is encoded in color according to scale bar above graph. Profile vector direction and distance along vector are shown on the left-hand side. Arrowheads point to the profile of the time point shown in A. Note the jagged appearance of the color stripes indicating changes in the longitudinal position of fluorescent puncta. C, Correlation (Pearson) of profile vectors shown in B with vector at time t = 0 for all consecutive time points (blue circles). Red horizontal lines are averages of correlation values over 30 min intervals.
Figure 4.
Figure 4.
Stimulation leads to a temporary dispersion of EGFP:SV2A fluorescence. A, An axon belonging to a neuron expressing EGFP:SV2A. Fluorescence levels are encoded in false color according to color scale in Figure 2A. A 30 s stimulation at 20 Hz is followed by the dispersion of EGFP:SV2A fluorescence that recovers gradually over the next few minutes. The panels annotated with asterisks were collected ∼15 s after the beginning of the stimulation train. B, In some cases, morphological changes in synaptic boutons were observable in differential interference contrast images of the same region (arrowheads). In very rare cases, EGFP:SV2A fluorescence failed to recover (red arrowhead). Scale bar, 5 μm. C, Average dispersion and recovery kinetics (5 experiments, 318 boutons; average ± SEM). Red lines are fits to a sum of two exponentials with time constants of 0.6 and 8.6 min. D, Distribution of peak dispersion values (expressed as percentage of original bouton fluorescence). Negative values indicate fluorescence losses, while positive values indicate fluorescence gains. Note the large variability of these values. Same dataset as C.
Figure 5.
Figure 5.
Use dependence of synaptic vesicle pool size tenacity. A, Changes in EGFP:SV2A fluorescence over time before, during, and after a stimulation period (30 s at 20 Hz repeated every 5 min for 1 h). Data are shown for three conditions (average ± SEM): no stimulation, in the presence of CNQX and AP5 (6 separate experiments, 25 sites, 1380 boutons); stimulation in CNQX and AP5 (6 separate experiments, 25 sites, 1308 boutons); and stimulation without CNQX and AP5 (4 separate experiments, 20 sites, 1132 boutons). In all conditions, stimulation led to a reduction of EGFP:SV2A fluorescence that recovered within ∼10 min of stimulation cessation. The gradual reduction in baseline fluorescence (∼10% over 3 h) is due to photobleaching. Note that due to the sequential multisite imaging procedure, the temporal relationships between stimulus initialization/termination and imaging timing differed slightly between sites. As a result, the average dispersion-related fluorescence loss appears to be reduced compared with the time-locked, high temporal resolution experiments of Figure 4. B, SI decay rates for the same data and conditions as in A (average ± SEM). Under baseline conditions, the SI decays gradually (this, however, is not due to photobleaching as in A; see main text). Upon stimulation initiation, the SI decay rate increases. Note that upon stimulation cessation, the SI does not recover to baseline levels (as EGFP:SV2A fluorescence does). Rather, it gradually converges to baseline rates of SI decay. C, Distribution of normalized ranges (range/mean) for the nonstimulated dataset, calculated for each bouton as illustrated in Figure 2D.
Figure 6.
Figure 6.
Use dependence of active zone size tenacity. A, An axon belonging to a neuron expressing GFP:Bsn95-3938. Fluorescence levels are encoded in false color according to color scale in Figure 2A. Scale bar, 10 μm. B, Time-lapse image of region enclosed in rectangle in A. Images were collected at 5 min intervals (only a subset of these are shown here). Scale bar, 5 μm. C, Changes in fluorescence over time for three boutons pointed to by arrows in B. Raw measurements depicted by thin lines; smoothed (5-point low-pass filter) depicted as thick lines. D, Distribution of normalized range values for all boutons in these experiments (nonstimulated dataset only; see below). E, Changes in GFP:Bsn95-3938 fluorescence over time before, during, and after a stimulation period as in Figure 5. Data are shown for two conditions (average ± SEM): no stimulation (5 experiments, 26 sites, 639 boutons); and stimulation (5 experiments, 32 sites, 866 boutons). Both sets of experiments were performed in the presence of CNQX and AP5. The gradual reduction in baseline fluorescence (∼10%) is due to photobleaching. F, SI decay rates for the same data and conditions as in E (average ± SEM). Note that stimulation did not affect the SI decay rate. The apparent separation of the curves on the right-hand side is entirely attributable to 2 (of 32) atypical outliers in the stimulated cell dataset and is therefore not significant.
Figure 7.
Figure 7.
Spontaneous remodeling of Munc13-1:EYFP puncta. A, Cultured mice cortical neurons prepared from homozygous Munc13-1:EYFP knock-in mice and maintained in culture for 21 d. Fluorescence levels are encoded in false color as in Figure 2A. Scale bar, 10 μm. B, Time-lapse imaging of region enclosed in rectangle in A. Images were collected at 1 h intervals (only a subset of these shown here). Scale bar, 5 μm. C, Changes in fluorescence over time for three boutons pointed to by arrows in B. D, Distribution of normalized range values for all boutons analyzed in these experiments at three time points (7 fields of view from 3 experiments, 203 boutons). E, Changes in Munc13-1:EYFP puncta fluorescence over time (average ± SD). F, SI decay rates measured for all 7 fields of view. Data shown after smoothing with a three-time point low-pass filter. The average SI decay rate is shown by the thick black line.

Similar articles

Cited by

References

    1. Ahmari SE, Buchanan J, Smith SJ. Assembly of presynaptic active zones from cytoplasmic transport packets. Nat Neurosci. 2000;3:445–451. - PubMed
    1. Bajjalieh SM, Peterson K, Shinghal R, Scheller RH. SV2, a brain synaptic vesicle protein homologous to bacterial transporters. Science. 1992;257:1271–1273. - PubMed
    1. Bresler T, Shapira M, Boeckers T, Dresbach T, Futter M, Garner CC, Rosenblum K, Gundelfinger ED, Ziv NE. Postsynaptic density assembly is fundamentally different from presynaptic active zone assembly. J Neurosci. 2004;24:1507–1520. - PMC - PubMed
    1. Brigidi GS, Bamji SX. Cadherin-catenin adhesion complexes at the synapse. Curr Opin Neurobiol. 2011;21:208–214. - PubMed
    1. Bury LA, Sabo SL. Coordinated trafficking of synaptic vesicle and active zone proteins prior to synapse formation. Neural Dev. 2011;6:24. - PMC - PubMed

Publication types

MeSH terms

LinkOut - more resources