. 2011 Nov 16;31(46):16833-43.
doi: 10.1523/JNEUROSCI.2505-11.2011.

A distinct contribution of short-wavelength-sensitive cones to light-evoked activity in the mouse pretectal olivary nucleus

Affiliations

A distinct contribution of short-wavelength-sensitive cones to light-evoked activity in the mouse pretectal olivary nucleus

Annette E Allen et al. J Neurosci. .

Abstract

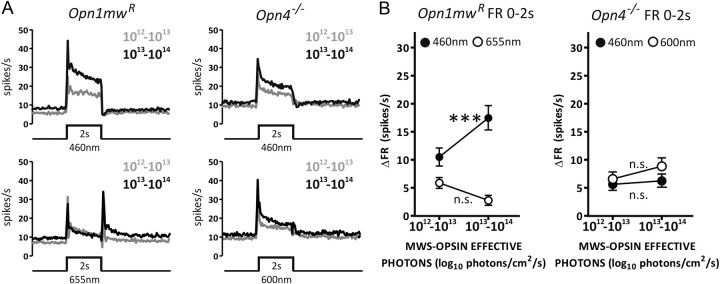
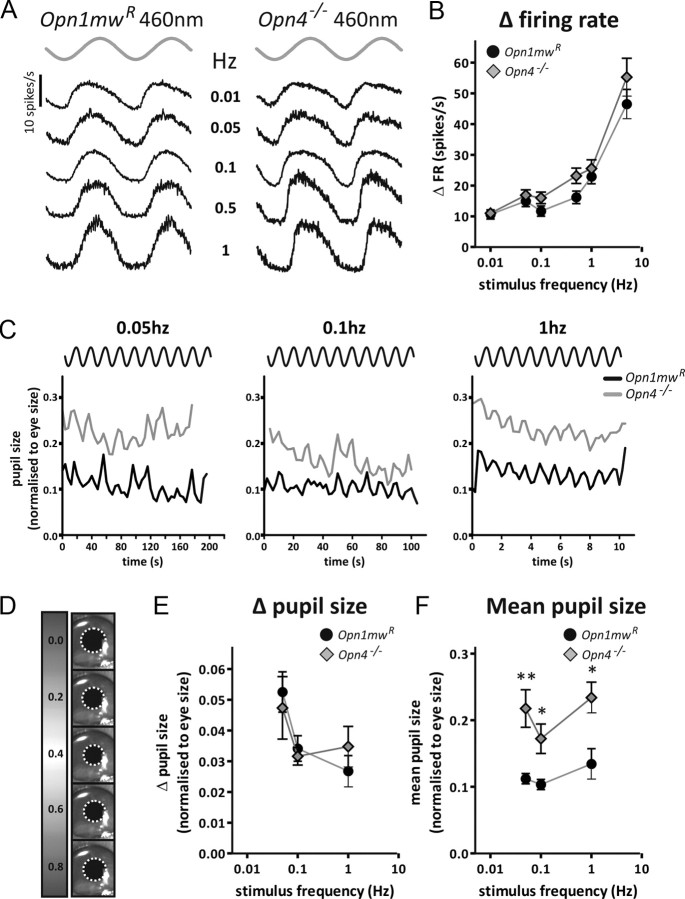
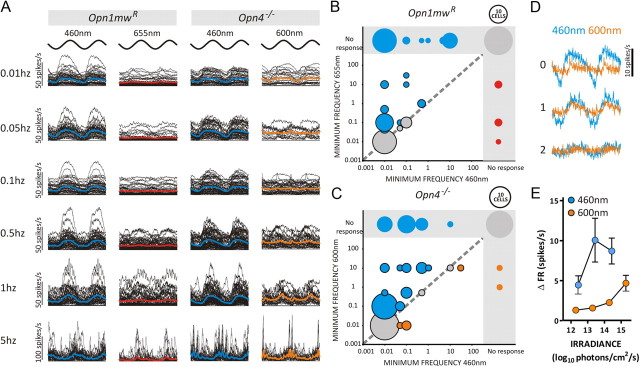
Melanopsin-expressing intrinsically photosensitive retinal ganglion cells (ipRGCs) combine inputs from outer-retinal rod/cone photoreceptors with their intrinsic phototransduction machinery to drive a wide range of so-called non-image-forming (NIF) responses to light. Defining the contribution of each photoreceptor class to evoked responses is vital for determining the degree to which our sensory capabilities depend on melanopsin and for optimizing NIF responses to benefit human health. We addressed this problem by recording electrophysiological responses in the mouse pretectal olivary nucleus (PON) (a target of ipRGCs and origin of the pupil light reflex) to a range of gradual and abrupt changes in light intensity. Dim stimuli drove minimal changes in PON activity, suggesting that rods contribute little under these conditions. To separate cone from melanopsin influences, we compared responses to short (460 nm) and longer (600/655 nm) wavelengths in mice carrying a red shifted cone population (Opn1mw®) or lacking melanopsin (Opn4⁻/⁻). Our data reveal a surprising difference in the quality of information available from medium- and short-wavelength-sensitive cones. The majority cone population (responsive to 600/655 nm) supported only transient changes in firing and responses to relatively sudden changes in light intensity. In contrast, cones uniquely sensitive to the shorter wavelength (S-cones) were better able to drive responses to gradual changes in illuminance, contributed a distinct off inhibition, and at least partially recapitulated the ability of melanopsin to sustain responses under continuous illumination. These data reveal a new role for S-cones unrelated to color vision and suggest renewed consideration of cone contributions to NIF vision at shorter wavelengths.


Figures

Figure 1.
Figure 1.
Identification of single units. A, Representative scatter plot of spike waveforms plotted using the first two principal components (PC). Two clusters are readily identified (unit 1, gray; unit 2, white). x-Axis, PC1; y-axis, PC2. For clarity, noise events are not plotted. B, Pairwise comparison of each cluster through cross-correlation of spike times reveals no discernible relationship between spike firing in each cluster (probability of correlated firing <0.01). C, Mean ± SD of spike waveform for the two units identified in A. D, Raster plot showing the response of each unit to repeated 460 nm light pulses (15.8 log10 photons/cm2/s). E, Log interspike interval (ISI) for each unit. Unit 1 shows clear sharp peaks at discrete intervals, indicative of spikes fired in bursts. Comparatively, unit 2 shows a broad peak at longer interspike intervals, representative of tonic firing patterns.
Figure 2.
Figure 2.
Light responses in the murine PON and surrounding pretectum. A, Location of the murine PON determined by parvalbumin (PV) immunohistochemistry (white staining). PV expression (bottom) is broadly consistent with the atlas definition of the PON (top), which shows the PON, highlighted in red, to extend from approximately −2.4 to 2.8 mm from bregma (Paxinos and Franklin, 2001). B, Representative multiunit responses to a 2 s, 460 nm stimulus (15.8 log10 photons/cm2/s). Each peristimulus time histogram corresponds to a single recording site, with timing of the light pulse shown in diagram form below and as a gap in the background shading. The shaded oval area in top right shows the approximate extent of the PON. Right panel shows representative single units extracted from recording sites within (a, d, e) and outside (b, c) the PON. Most light-responsive neurons in the pretectum showed strong on excitation, but the degree to which this was sustained throughout light exposure was much greater in the PON. The anatomical distribution of such sustained (orange) and transient (black) cells as well as of those that were unresponsive to light (white) over a number of such recordings in Opn1mwR mice is shown in C. Inset quantifies total numbers of each cell type. Total cells recorded from six animals: n = 420. Within PON, n = 149 sustained cells and n = 15 transient cells.
Figure 3.
Figure 3.
Spectral sensitivity of PON responses in Opn1mwR mice. A, The mean response of PON cells with a sustained phenotype to 30 s LWS-isoluminant 460 and 655 nm (blue and red lines, respectively) stimuli. Four presentations of each stimulus were separated by a 300 s interstimulus interval. Numbers to the left depict irradiance as a log10 proportion of the brightest pulse (14.8 and 15.6 log10 photons/cm2/s for 460 and 655 nm stimuli, or 14.2 log10 LWS-effective photons/cm2/s). The difference in sustained firing elicited by these two wavelengths is highlighted in B, which shows the mean ± SEM firing rate 20–30 s after stimulus onset as a function of irradiance. C, The decay of 460 and 655 nm responses in sustained cells, isoluminant for LWS opsin-effective photons (14.2 log10 photons/cm2/s). Both curves are fitted with two-phase exponential decay curves (dotted lines), with equations displayed in the inset. Responses to 460 and 655 nm show decay kinetics that are not significantly different (F test, p = 0.096); this is confirmed by the subtraction of 655 nm responses from 460 nm (solid black line), revealing a steady-state elevation in firing rate that separates the two responses. D and E show equivalent data to A and B for the small number of transient neurons found in the Opn1mwR PON. n = 151 sustained and n = 15 transient units from 6 mice.
Figure 4.
Figure 4.
A unique S-cone contribution to the PON response. A, Mean responses of sustained cells in Opn4−/− or rd/rd cl (black lines) and Opn1mwR (blue lines) mice exposed to 30 s, 460 nm stimuli over a range of irradiances. Four presentations of each stimulus were separated by a 300 s interstimulus interval. Number to left of each trace indicates irradiance as a log10 proportion of the brightest pulse (15.8 log10 photons/cm2/s). B, A plot of mean ± SEM firing rate 20–30 s after stimulus onset as a function of irradiance confirms the ability of all genotypes to show sustained firing at higher irradiances. C, Mean ± SEM firing rate above prestimulus baseline in Opn4−/− mice exposed to MWS-isoluminant 460 nm (blue trace) and 600 nm (orange trace) stimuli confirm the existence of a short-wavelength-sensitive sustained component to the PON response in this genotype. Numbers to left of traces depict irradiance as a log10 proportion of the brightest stimulus (14.2 log10 MWS opsin-effective photons/cm2/s). Subtracting 600 nm from 460 nm responses (solid black line) reveals a short-wavelength-specific response component at higher irradiances that shows little decay over 30 s of light exposure. D, Mean firing rate above prestimulus baseline for sustained cells in the PON around the end of a 30 s pulse. Left to right, rd/rd cl 460 nm, Opn1mwR 655 nm, Opn1mwR 460 nm, Opn4−/− 460 nm, and Opn4−/− 600 nm responses. Numbers to left depict log10 irradiance relative to brightest stimuli (15.8, 15.3, and 15.6 log10 photons/cm2/s for 460, 600, and 655 nm, respectively). Recordings at each irradiance across all genotypes and wavelengths were isoluminant for MWS or, in the case of Opn1mwR mice, LWS opsin. Dashed line represents baseline firing rate. Note the strong inhibition at lights off in the conditions expected also to activate S-cones (460 nm irradiances above −2 in Opn1mwR and Opn4−/− mice). Opn1mwR, n = 151 sustained cells from 6 animals; Opn4−/−, n = 68 sustained cells from 6 animals; rd/rd cl, n = 63 sustained cells from 8 animals.
Figure 5.
Figure 5.
Responses of Opn1mwR and Opn4−/− mice to irradiance and contrast. A, Mean firing rate in sustained neurons in the PON of Opn1mwR or Opn4−/− mice exposed to a 2 s, 1-log unit, step in irradiance. The numbers in the top right of each trace show the irradiance in MWS-effective (for Opn4−/−) or LWS-effective (for Opn1mwR) photons/cm2/s of the 460 nm background (panel 1) and the 2 s step (panel 2). In the top two panels, the step was rendered in 460 nm. In the bottom two, the step was rendered in a melanopsin and S-cone silent wavelength, 655 nm for Opn1mwR and 600 nm for Opn4−/−. A strong response to the light step was observed in all conditions. B, To determine the degree to which these were responses to contrast versus stimulus irradiance, the average change in firing rate (FR) from baseline during stimulus presentation was compared between high- and low-irradiance steps for each wavelength, in each genotype (symbols show mean ± SEM for all animals). The higher-irradiance step only drove a significantly larger response when it was rendered in 460 nm and presented to Opn1mwR mice (one-tailed t test, **p > 0.01). This is the only situation in which melanopsin is predicted to contribute to the responses. In all other conditions, there was no increase in the magnitude of responses when presented against the higher background illumination, suggesting that responses were defined mostly by the relative increase in irradiance (contrast), which was constant across conditions. Opn1mwR, n = 52 sustained cells from 6 animals; Opn4−/−, n = 48 sustained cells from 7 animals.
Figure 6.
Figure 6.
Responses of Opn1mwR and Opn4−/− mice to sinusoidal oscillations in light intensity. A, Average change in firing rate (relative to baseline) of PON neurons in Opn1mwR and Opn4−/− mice to sinusoidal oscillations in light intensity (peak and trough irradiances 13.2 and 14.2 MWS opsin-effective photons/cm2/s, respectively). Responses to sinusoids in the 0.01–1 Hz range are shown with the stimulus depicted in gray above to give an idea of phasing. B, The strong dependence of response amplitude on stimulus frequency and the lack of a marked deficit in the Opn4−/− response was confirmed in mean ± SEM peak-to-trough amplitudes. Only those units showing a statistically significant response at any frequency (p < 0.001, χ2 periodogram) are included here. n = 52 cells from 6 Opn1mwR animals; n = 48 cells from 7 Opn4−/− mice. C, Traces of pupil size for representative Opn1mwR and Opn4−/− mice exposed to sinusoidal oscillations in light intensity (phasing of stimuli shown above each graph; peak and trough irradiances 12.3 and 13.3 MWS opsin-effective photons/cm2/s, respectively) at 0.05, 0.1, and 1 Hz confirms the ability of both genotypes to respond over this frequency range. Modulations in pupil size were best fit with sinusoidal curves of the correct frequency compared with a straight line (F test, p < 0.05 at all frequencies in Opn1mwR and Opn4−/− mice). An idea of the absolute magnitude of these responses is provided in D, showing pupil imaged for an Opn1mwR mouse during one cycle of a 1 Hz sinusoid (figures to left show time in seconds after trough in irradiance). E, The magnitude of the peak-to-trough oscillation in pupil size was not noticeably different between genotypes. F, The overall degree of pupil constriction (mean pupil size across oscillations) was, however, significantly greater in Opn1mwR animals. Data are compared with two-tailed t test, *p > 0.05, **p > 0.01. Symbols show mean ± SEM pupil size normalized to eye size; n = 5 animals for each group.
Figure 7.
Figure 7.
Wavelength-dependent temporal frequency tuning within the PON. A, Traces of the change in firing (with respect to baseline) elicited by sinusoidal modulations in light intensity over a range of frequencies rendered in either a short (460 nm) or longer (655/600 nm) wavelength for individual Opn1mwR and Opn4−/− cells. The stimulus is shown above for phase information. Solid blue/red/orange lines depict the mean response for each condition. Only cells showing a significant change in firing rate (χ2 periodogram, p < 0.001) in that condition were included. Peak-to-trough irradiance was set at 13.2 to 14.2 LWS/MWS opsin-effective photons/cm2/s under all conditions. The enhanced ability to track low-frequency oscillations at 460 nm was also evident in plots (B, C) depicting the minimum frequency at which significant responses were observed at each wavelength in Opn1mwR (B) and Opn4−/− (C) mice. Circled area is scaled to represent number of cells in each group (circle size for 10 cells shown above each graph for comparison) and color coded such that blue represents cells showing a lower-threshold frequency at 460 than 655/600 nm, red/orange cells for which the converse was true, and gray cells whose threshold frequency was the same at both wavelengths. Cells showing no significant response to either or both wavelengths are found in the gray shaded area of each graph. The spectral sensitivity of high-amplitude responses at lower frequencies was consistent with an S-cone origin. Thus, plots of either average response profile (D) or response amplitude (E; peak-to-trough change in firing) in Opn4−/− mice exposed to 0.1 Hz sinusoids of equivalent contrast (10× increase MWS-effective irradiance from trough-to-peak) revealed large responses at 460 but not 600 nm and only at higher mid-point irradiances (shown as figures reporting log10 proportion of the brightest condition in D and in total photon flux for E). n = 52 cells from 6 Opn1mwR and n = 48 cells from 7 Opn4−/− animals.

References

    1. Altimus CM, Güler AD, Alam NM, Arman AC, Prusky GT, Sampath AP, Hattar S. Rod photoreceptors drive circadian photoentrainment across a wide range of light intensities. Nat Neurosci. 2010;13:1107–1112. - PMC - PubMed
    1. Bailes HJ, Lucas RJ. Melanopsin and inner retinal photoreception. Cell Mol Life Sci. 2010;67:99–111. - PMC - PubMed
    1. Belenky MA, Smeraski CA, Provencio I, Sollars PJ, Pickard GE. Melanopsin retinal ganglion cells receive bipolar and amacrine cell synapses. J Comp Neurol. 2003;460:380–393. - PubMed
    1. Berson DM, Dunn FA, Takao M. Phototransduction by retinal ganglion cells that set the circadian clock. Science. 2002;295:1070–1073. - PubMed
    1. Brown TM, Gias C, Hatori M, Keding SR, Semo M, Coffey PJ, Gigg J, Piggins HD, Panda S, Lucas RJ. Melanopsin contributions to irradiance coding in the thalamo-cortical visual system. PLoS Biol. 2010;8:e1000558. - PMC - PubMed

Publication types

MeSH terms

LinkOut - more resources