. 2011:2011:215496.
doi: 10.1155/2011/215496. Epub 2011 Aug 7.

Signatures of drug sensitivity in nonsmall cell lung cancer

Affiliations

Signatures of drug sensitivity in nonsmall cell lung cancer

Hua C Gong et al. Int J Proteomics. 2011.

Abstract

We profiled receptor tyrosine kinase pathway activation and key gene mutations in eight human lung tumor cell lines and 50 human lung tumor tissue samples to define molecular pathways. A panel of eight kinase inhibitors was used to determine whether blocking pathway activation affected the tumor cell growth. The HER1 pathway in HER1 mutant cell lines HCC827 and H1975 were found to be highly activated and sensitive to HER1 inhibition. H1993 is a c-MET amplified cell line showing c-MET and HER1 pathway activation and responsiveness to c-MET inhibitor treatment. IGF-1R pathway activated H358 and A549 cells are sensitive to IGF-1R inhibition. The downstream PI3K inhibitor, BEZ-235, effectively inhibited tumor cell growth in most of the cell lines tested, except the H1993 and H1650 cells, while the MEK inhibitor PD-325901 was effective in blocking the growth of KRAS mutated cell line H1734 but not H358, A549 and H460. Hierarchical clustering of primary tumor samples with the corresponding tumor cell lines based on their pathway signatures revealed similar profiles for HER1, c-MET and IGF-1R pathway activation and predict potential treatment options for the primary tumors based on the tumor cell lines response to the panel of kinase inhibitors.


Figures

Figure 1
Figure 1
Profiling of the activated (p-Tyr) RTK signaling pathways in the lung tumor cell lines. (a) Slide images of the CEER assay obtained from the eight tumor cell lines (please see the supplemental data and methods for experimental details available online at doi: 10.1155/2011/215496). (b) Graphical representation of the activated (p-Tyr) RTK pathways in the lung tumor cell lines profiled by the CEER assay. The cells were cultured in the presence of 10% FBS in their respective medium until 80% confluence and cell lysates were prepared in lysis buffer. The activation signal was determined from the harvested lysate. In each cell line the activated pathways are shown in RFU (relative fluorescent units) based on the lysate obtained from the number of cells being assayed.
Figure 2
Figure 2
Inhibition of signaling pathway activation in lung tumor cell lines by kinase inhibitors. Lung tumor cells were cultured in 10% FBS until reaching ~80% confluence and then the cells were starved in serum-free medium for overnight, followed by 4-hour treatment with the inhibitors. Cell lysates were then prepared and used for determination of the pathway activation signals by the CEER assay.
Figure 3
Figure 3
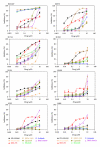
Inhibition of lung tumor cell growth by kinase inhibitors. Lung tumor cells were cultured in 5% FBS plus increasing concentrations of the indicated inhibitors, ranging from 0.01–10 μM, for 48 hours. Determination of cell proliferation was performed with the CellTiter-Glo Luminescent Cell Viability Assay.
Figure 4
Figure 4
Inhibition of anchorage-independent growth of lung tumor cell lines by selected inhibitors. Each selected cell line was treated with the indicated inhibitor at 0.1 μM and 1 μM concentrations for two weeks and cell colony size formation was scored under the Nikon inverted-phase microscope.
Figure 5
Figure 5
Inhibition of lung tumor cell growth by a combination of two kinase inhibitors. Lung tumor cell lines were cultured in 5% FBS plus increasing concentrations of the indicated single kinase inhibitor or a combination of the two indicated kinase inhibitors. Determination of cell proliferation was performed with the CellTiter-Glo Luminescent Cell Viability Assay.
Figure 6
Figure 6
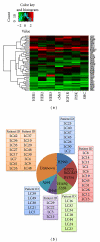
(a) Heat Map representing the activated signaling pathways found in the 50 lung tumor tissue samples and eight lung tumor cell lines. Each row constitutes all the pathway markers determined from an individual tumor sample organized in color columns. Green and red denote markers that are present at lower and higher levels, respectively. (b) Clustering of the 50 lung tumor samples with the corresponding lung tumor cell lines based on the similarities in the markers between the tissue samples and the cell lines.

References

    1. Jemal A, Bray F, Center MM, Ferlay J, Ward E, Forman D. Global cancer statistics. CA Cancer Journal for Clinicians. 2011;61:69–90. - PubMed
    1. Vaporciyan AA, Nesbitt JC, Lee JS, et al. Holland-Frei Cancer Medicine. 5th edition. BC Decker; 2000.
    1. Roggli VL, Vollmer RT, Greenberg SD, McGavran MH, Spjut HJ, Yesner R. Lung cancer heterogeneity: a blinded and randomized study of 100 consecutive cases. Human Pathology. 1985;16(6):569–579. - PubMed
    1. Schiller JH, Harrington D, Belani CP, et al. Comparison of four chemotherapy regimens for advanced non-small-cell lung cancer. The New England Journal of Medicine. 2002;346(2):92–98. - PubMed
    1. Comis RL. The current situation: erlotinib (Tarceva) and gefitinib (Iressa) in non-small cell lung cancer. The Oncologist. 2005;10(7):467–470. - PubMed