. 2011 Nov 17:9:73.
doi: 10.1186/1477-5956-9-73.

Variance decomposition of protein profiles from antibody arrays using a longitudinal twin model

Affiliations

Variance decomposition of protein profiles from antibody arrays using a longitudinal twin model

Bernet S Kato et al. Proteome Sci. .

Abstract

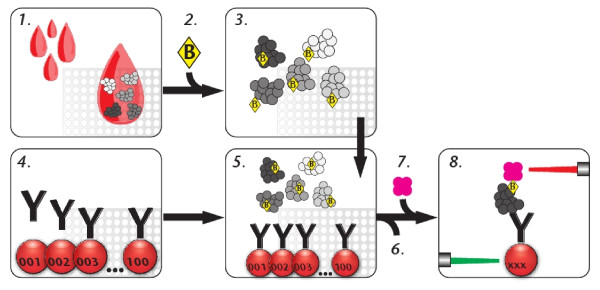
Background: The advent of affinity-based proteomics technologies for global protein profiling provides the prospect of finding new molecular biomarkers for common, multifactorial disorders. The molecular phenotypes obtained from studies on such platforms are driven by multiple sources, including genetic, environmental, and experimental components. In characterizing the contribution of different sources of variation to the measured phenotypes, the aim is to facilitate the design and interpretation of future biomedical studies employing exploratory and multiplexed technologies. Thus, biometrical genetic modelling of twin or other family data can be used to decompose the variation underlying a phenotype into biological and experimental components.

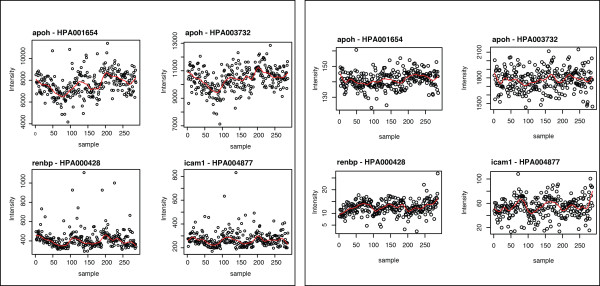
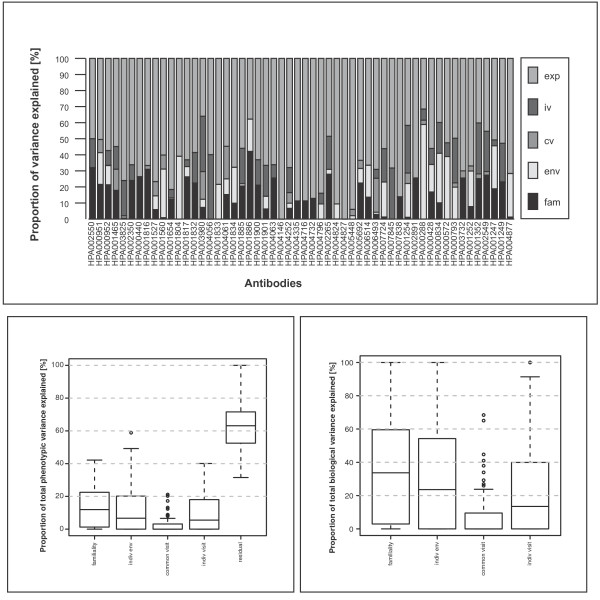
Results: Using antibody suspension bead arrays and antibodies from the Human Protein Atlas, we study unfractionated serum from a longitudinal study on 154 twins. In this study, we provide a detailed description of how the variation in a molecular phenotype in terms of protein profile can be decomposed into familial i.e. genetic and common environmental; individual environmental, short-term biological and experimental components. The results show that across 69 antibodies analyzed in the study, the median proportion of the total variation explained by familial sources is 12% (IQR 1-22%), and the median proportion of the total variation attributable to experimental sources is 63% (IQR 53-72%).

Conclusion: The variability analysis of antibody arrays highlights the importance to consider variability components and their relative contributions when designing and evaluating studies for biomarker discoveries with exploratory, high-throughput and multiplexed methods.


Figures

Figure 1
Figure 1
Experimental workflow - The process begins with (1.) the distribution of samples into microtiter plates according to a defined layout, dilution and heat treatment. (2.) The protein content of the samples is then label with biotin and (3.) the samples are then prepared for the assay and heat-treated again. Alongside this, (4.) the antibodies are coupled onto beads with distinct color-codes and an array in suspension is created and (5.) beads and samples are combined and incubated. (6.) Proteins that have not been captures by the antibodies are removed and (7.) fluorescent streptavidin is added to bind to the target proteins via their biotin modification. (8.) The beads are then measured and the co-occurrence of beads, which are identified via a green laser, and the emitted reporter fluorescence, excited by a red laser, allowing determining interaction dependent intensity values in multiplex.
Figure 2
Figure 2
Protein profiles. A) Profiles before any data processing are shown from four antibodies across all samples. B) Profiles for the antibodies are shown after normalization, removal of outliers and BoxCox transformation. The red line indicates the locally weighted scatterplot smoothing (LOWESS). The vertical dashed lines differentiate between three microtiter plates in which the samples were distributed. Graphs from all antibodies pre and post data treatment are found in Additional Files 1 and 2.
Figure 3
Figure 3
Correlation model. Suppose we have three duplicated samples 1, 2 and 3 assayed at 6 antibodies B1 - B6. Denoting the aliquot pairs of the samples as 1a, 1b, 2a, 2b, 3a and 3c (see table above), to check the within sample concordance we look at correlations between the 6 pairs of 3 dimensional vectors. That is for each of the antibodies B1, B2 and B3, we determine the correlation between the black and light-grey vectors. Similarly for antibodies B2, B4 and B6 we look at the correlation between the white and dark-grey vectors.
Figure 4
Figure 4
Principal component projection. The graph shows the normalized data for the 270 samples in the dataset in the two-dimensional antibodies space. Outlying samples are marked with numbers.
Figure 5
Figure 5
Variance decomposition. A) The bar plot summarizes the decomposition of total phenotypic variance of each antibody. The colours in each bar represent the proportion of total phenotypic variability attributable to familiality (fam), individual environment (env), common visit (cv), individual visit (iv), and residual variance (exp). B) Boxplots summarizing the decomposition of total phenotypic variance across all antibodies. C) Boxplots summarizing the decomposition of biological (i.e non- experimental) variability across all antibodies.
Figure 6
Figure 6
Correlation of profiles of HPA001886 and HPA003412. A) The intensity profiles from antibodies targeting IL-12 and PLAT were found to be strongly negatively correlated (R = -0.95, red line), which suggested a biological connection between these two proteins. B) When the correlation investigation of IL-12 (black circles) and PLAT (open diamonds) was extended to all other antibodies, no correlation value outside the range of 0.5 and -0.5 was found.

References

    1. Lesko LJ, Atkinson AJ Jr. Use of biomarkers and surrogate endpoints in drug development and regulatory decision making: criteria, validation, strategies. Annu Rev Pharmacol Toxicol. 2001;41:347–366. doi: 10.1146/annurev.pharmtox.41.1.347. - DOI - PubMed
    1. Atkinson AJ, Colburn WA, DeGruttola VG, DeMets DL, Downing GJ, Hoth DF, Oates JA, Peck CC, Schooley RT, Spilker BA. et al.Biomarkers and surrogate endpoints: Preferred definitions and conceptual framework. Clinical Pharmacology & Therapeutics. 2001;69:89–95. - PubMed
    1. Gry M, Rimini R, Stromberg S, Asplund A, Ponten F, Uhlen M, Nilsson P. Correlations between RNA and protein expression profiles in 23 human cell lines. BMC Genomics. 2009;10:365. doi: 10.1186/1471-2164-10-365. - DOI - PMC - PubMed
    1. Cho WC. Proteomics technologies and challenges. Genomics Proteomics Bioinformatics. 2007;5:77–85. doi: 10.1016/S1672-0229(07)60018-7. - DOI - PMC - PubMed
    1. Lubomirski M, D'Andrea MR, Belkowski SM, Cabrera J, Dixon JM, Amaratunga D. A consolidated approach to analyzing data from high-throughput protein microarrays with an application to immune response profiling in humans. J Comput Biol. 2007;14:350–359. doi: 10.1089/cmb.2006.0116. - DOI - PubMed

LinkOut - more resources