. 2011 Nov 15;20(5):606-19.
doi: 10.1016/j.ccr.2011.09.012.

Oxidative damage targets complexes containing DNA methyltransferases, SIRT1, and polycomb members to promoter CpG Islands

Affiliations

Oxidative damage targets complexes containing DNA methyltransferases, SIRT1, and polycomb members to promoter CpG Islands

Heather M O'Hagan et al. Cancer Cell. .

Abstract

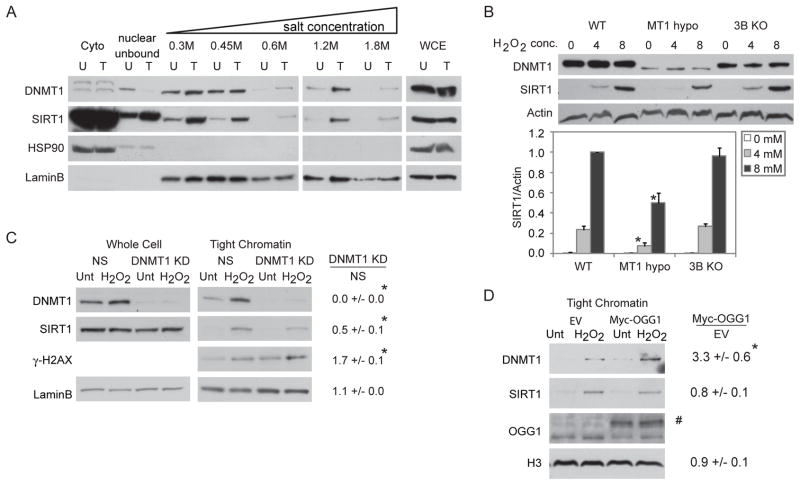
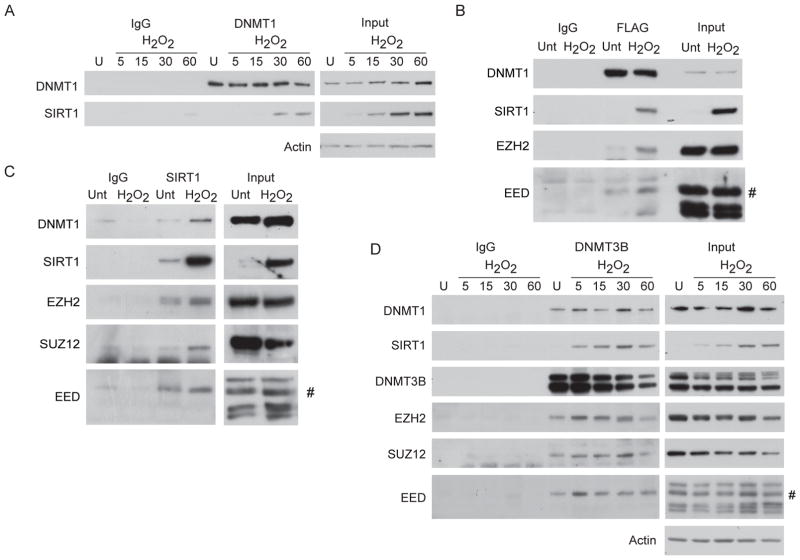
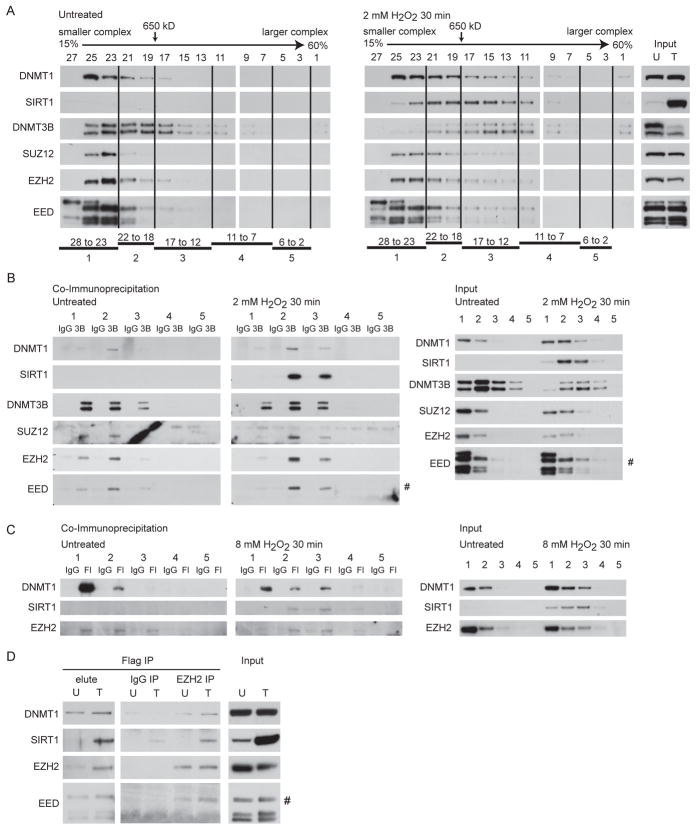
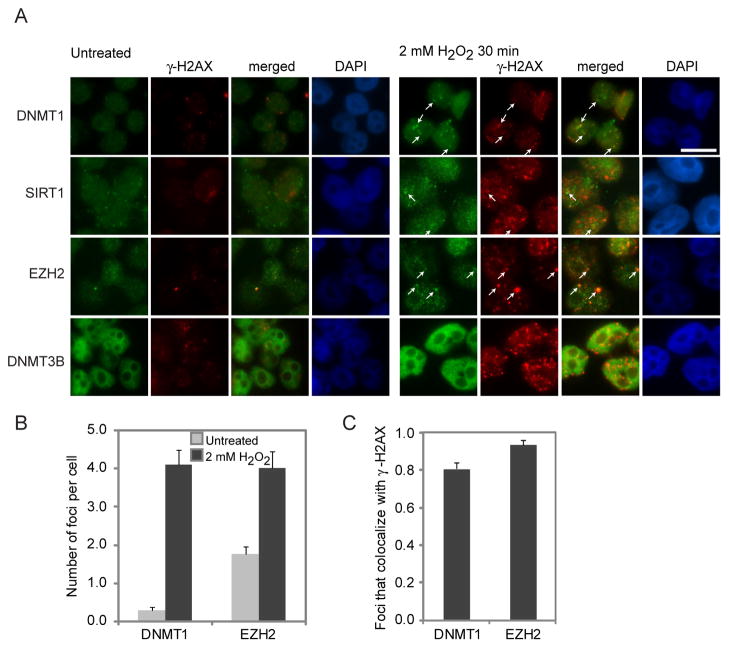
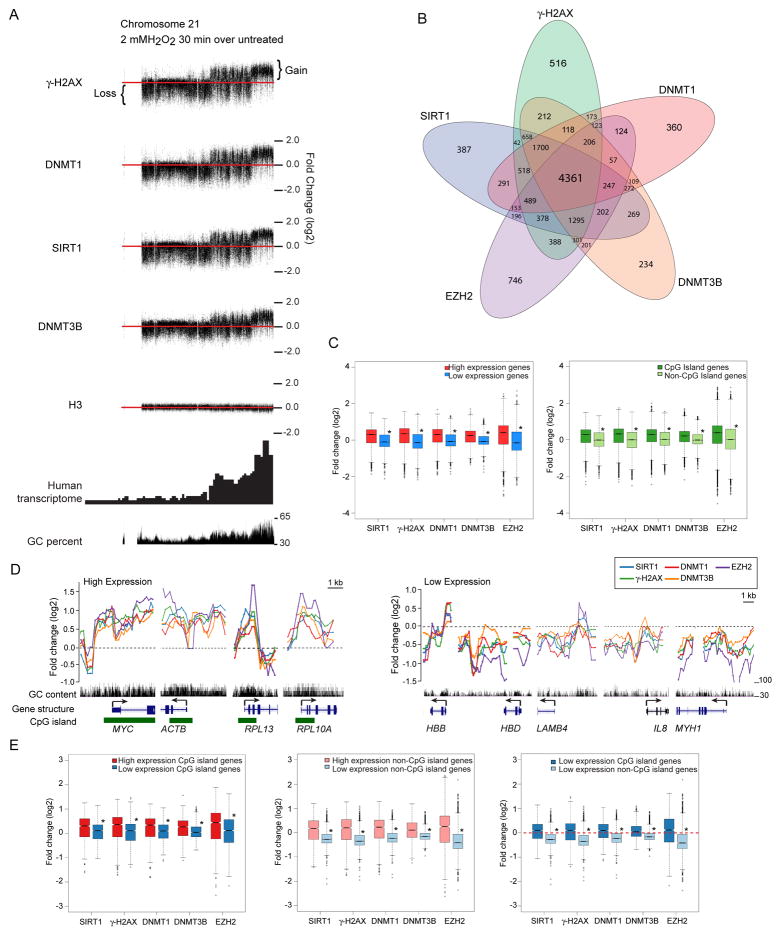
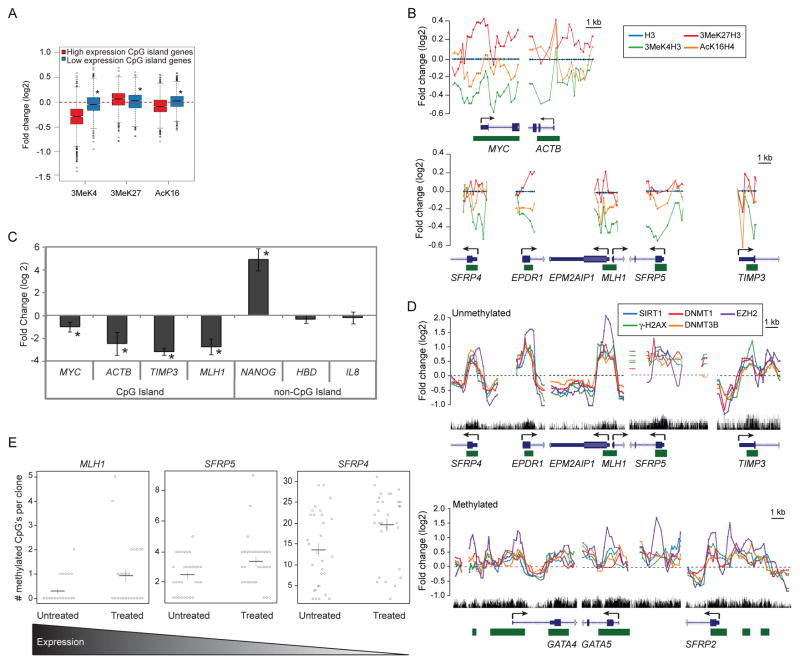
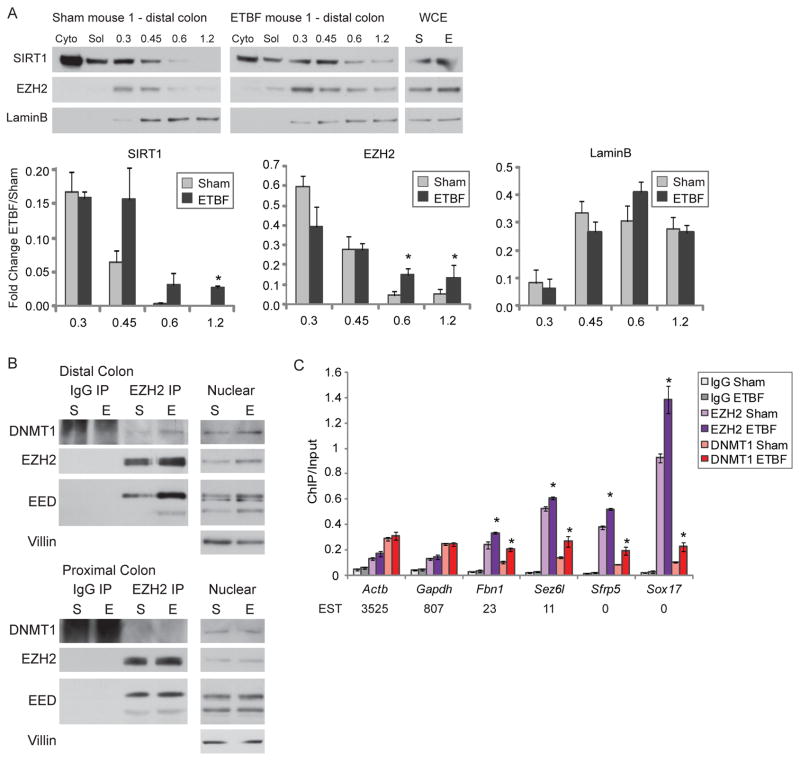
Cancer cells simultaneously harbor global losses and gains in DNA methylation. We demonstrate that inducing cellular oxidative stress by hydrogen peroxide treatment recruits DNA methyltransferase 1 (DNMT1) to damaged chromatin. DNMT1 becomes part of a complex(es) containing DNMT3B and members of the polycomb repressive complex 4. Hydrogen peroxide treatment causes relocalization of these proteins from non-GC-rich to GC-rich areas. Key components are similarly enriched at gene promoters in an in vivo colitis model. Although high-expression genes enriched for members of the complex have histone mark and nascent transcription changes, CpG island-containing low-expression genes gain promoter DNA methylation. Thus, oxidative damage induces formation and relocalization of a silencing complex that may explain cancer-specific aberrant DNA methylation and transcriptional silencing.


Figures

Figure 1
Figure 1. DNMT1 and SIRT1 Become Tightly Bound to Chromatin after Treatment with H2O2
(A) NCCIT cells were untreated (U) or treated with 1 mM H2O2 for 30 minutes (T). Cell pellets were extracted sequentially using cytoplasmic extraction buffer (Cyto), soluble nuclear buffer (nuclear unbound), and buffers with increasing NaCl concentration. Whole cell lysates were prepared separately (WCE). (B) HCT116 (WT), HCT116 hypomorphic DNMT1 (MT1 hypo), and HCT116 DNMT3B KO (3B KO) cells were treated with H2O2 at the indicated concentrations in mM for 30 minutes and total nuclear protein was collected. y-axis is SIRT1 over Actin levels relative to 8 mM treated WT cells. The data presented is the mean of three independent experiments +/− SEM. * p < 0.05 by t-test. (C) NCCIT cells were infected with non-specific shRNA (NS) or DNMT1 shRNA. After 72 hours, they were untreated (Unt) or treated with 1 mM H2O2 for 30 minutes (H2O2). Tight chromatin is the remaining protein in the chromatin pellet after extraction with 0.45 M NaCl buffer. Band densitometry values are displayed as the ratio of DNMT1 knockdown over NS knockdown for protein levels in H2O2 treated cells. The data presented is the mean of three independent experiments +/− SEM. * p < 0.05 by one-tail t-test. (D) NCCIT cells were transiently transfected with empty vector (EV) or c-Myc-tagged OGG1 (Myc-OGG1) plasmids for 48 hours followed by 1 mM H2O2 treatment and analysis as in (C). # Myc-OGG1. * p < 0.05 by one-tail t-test. See also Figure S1.
Figure 2
Figure 2. Oxidative Damage Induces the Interaction between SIRT1, DNMTs, and PcG Components
(A) NCCIT cells were untreated or treated with 2 mM H2O2 and collected at the indicated time points in minutes after addition of H2O2 to the media. Co-immunoprecipitations were performed with control IgG or anti-DNMT1 antibodies. (B) HCT116 DNMT1 hypomorph cells expressing FLAG-DNMT1 were treated with 8 mM H2O2 for 30 minutes. Co-immunoprecipitations were performed using control IgG or anti-FLAG antibodies. # isoform 2 of EED. (C) NCCIT cells were treated with 2 mM H2O2 for 30 minutes and co-immunoprecipitations were performed using control IgG or anti-SIRT1 antibodies. # isoform 2 of EED. (D) NCCIT cells were treated as in (A) and co-immunoprecipitations were performed using control IgG or anti-DNMT3B antibodies. # isoform 2 of EED. See also Figure S2.
Figure 3
Figure 3. H2O2 Treatment Induces the Formation of a Large Complex(es) Containing DNA Methyltransferases, SIRT1, and Polycomb Group Proteins
(A) Nuclear extracts from untreated NCCIT cells or cells treated with 2 mM H2O2 for 30 minutes were added to a 15 to 60% sucrose gradient and fractions were assayed by immunoblotting. Fraction numbers and 650 kDa molecular mass standard are across the top. Larger fraction numbers indicate smaller molecular weight of the complex(es). (B) Fractions from (A) were pooled into 5 groups as indicated at the bottom of (A). Co-immunoprecipitations for control IgG or anti-DNMT3B (3B) antibodies were performed from the pooled fractions. Right panels are inputs from the pooled fractions. # isoform 2 of EED. (C) HCT116 DNMT1 hypomorph cells expressing FLAG-DNMT1 were untreated or treated with 8 mM H2O2 for 30 minutes. Nuclear extracts, sucrose gradients, and pooling of fractions were performed as in (A). Co-immunoprecipitations for control IgG or anti-FLAG (Fl) antibodies were performed from pooled fractions. Right panels are inputs from the pooled fractions. (D) Flag co-immunoprecipitations were performed in HCT116 DNMT1 hypomorph cells expressing FLAG-DNMT1 that were either untreated (U) or treated with 8 mM H2O2 for 30 minutes (T). After elution with flag peptide (elute) a second immunoprecipitation was done using IgG or EZH2 antibodies. # isoform 2 of EED.
Figure 4
Figure 4. DNMT1 and EZH2 Form Nuclear Foci after H2O2 Treatment that Co-localize with γ-H2AX
(A) NCCIT cells were untreated or treated with 2 mM H2O2 for 30 minutes. Immunofluorescence analysis was performed using the indicated antibodies. White arrows indicate examples of foci. White scale bar is 5 μm. (B) More than 50 nuclei from cells in (A) were scored per antibody in at least two independent experiments. Graphs represent the sample mean +/− SEM. Grey and black bars are untreated and H2O2 treated cells, respectively. (C) More than 50 nuclei from cells in (A) were scored per antibody in at least two independent experiments. Graphs represent the sample mean +/− SEM. Black bars are H2O2 treated cells. See also Figure S3.
Figure 5
Figure 5. Oxidative Damage Induces Recruitment of Silencing Proteins to the Promoters of Actively Transcribed Genes and/or High GC Content Regions
(A) SW480 cells were either untreated or treated with 2 mM H2O2 for 30 minutes, followed by ChIP-Chip using the whole chromosome array of chromosomes 18, 19, and 21. Differences in log2 ratios of IP signals over input signals between treated and untreated samples were plotted along chromosome 21. Red line represents the zero (no change) line. Signals above and below the red line represent gain and loss, respectively, of corresponding marker. (B) Venn diagram for ChIP enriched genes for each antibody in treated over untreated samples. SW480 cells were either untreated or treated with 2 mM H2O2 for 30 minutes. ChIP samples were hybridized to the 244K promoter array. (C) For box plots, the y-axis depicts the differences in log2 ratios of IP signals over input signals between treated and untreated samples. For the left panel, red and blue represent the top 1000 genes with high and low expression, respectively, from expression array data. In the right panel, dark and light green represent groups of CpG island and non-CpG island genes, respectively. * p < 2×10⁻¹⁰ by two-tail t-test. (D) Plots of ChIP-chip signals in treated over untreated samples for individual genes. y-axis is the same as in (C). Black dash line represents the no change line. Black vertical bars indicate GC content, ranging from 30% to 100%. Blue lines-boxes represent the position and construction of genes, with the boxes indicating the position of exons, lines indicating the position of introns, and arrow indicating the direction of transcription. Green boxes represent the position of CpG islands. The names of genes are indicated at the bottom of the plots. (E) Values were plotted as in (C). In the left panel, red and blue represent the top 100 CpG island genes with high and low expression, respectively. In the middle panel, pink and light blue represent the top 100 non-CpG island genes with high and low expression, respectively. In the right panel, blue and light blue represent the top 100 CpG island and non-CpG island genes, respectively, with similar levels of low expression. Red dash line represents the no change line. See also Figure S4.
Figure 6
Figure 6. Gene Promoters with Oxidative Damage-Induced Enrichment of the Members of the Silencing Complex have Reduced Levels of Nascent Transcription and/or Increased CpG Methylation
(A) ChIP samples were hybridized to the 1M promoter array. Plots are of ChIP-chip signals from SW480 cells treated with 2 mM H2O2 for 30 minutes over untreated samples. Box plots are constructed as in Figure 5C except ChIP over input signals are normalized to H3. Red and blue represent the top 100 CpG island genes with high and low expression, respectively. * p< 2×10⁻¹⁰ by two-tail t-test. (B) Plots are constructed as in Figure 5D with ChIP signals normalized to H3. (C) SW480 cells were either untreated or treated with 2 mM H2O2 for 30 minutes and the nascent RNA was labeled concurrently. Quantitative RTPCR data are presented as the mean of the log 2 ratio of the treated over the untreated values for three independent biological replicates +/− SEM. * p < 0.05 by one-sided t-test. (D) Plots are constructed as in Figure 5D. (E) Bisulfite sequencing was performed on DNA from SW480 cells that were untreated or treated with 2 mM H2O2 for 30 minutes. Results are shown as a combination of three independent biological replicates with at least eight clones per experiment. Circles are the individual clones. Black horizontal lines are the mean for all clones with the vertical line representing the standard error. p-values by one-sided Welch’s t-test for MLH1, SFRP5, and SFRP4 are 0.014, 0.012, and 0.005, respectively. The gradient bar at the bottom depicts the relative log 2 basal expression levels, by expression array, which are 11.13, 6.82, and 6.40 for MLH1, SFRP5, and SFRP4, respectively. See also Figure S5.
Figure 7
Figure 7. In a Mouse Model of Acute Colonic Inflammation, Members of the Silencing Complex Become Enriched at Promoter CpG Islands of Low Expression Genes
(A) Mice were sham-inoculated (sham) or inoculated with ETBF. Two days post-inoculation, colon epithelial cells were extracted sequentially using cytoplasmic extraction buffer (Cyto), soluble nuclear buffer (Sol), and buffers with increasing NaCl concentration. Whole cell lysate was prepared separately (WCE). Blots from one set of representative mice are depicted. The value calculated for each fraction is the ratio of that fraction over the total of all fractions. The graphs represent the mean values for 3 separate mice +/− SEM. * p-value < 0.05 by one-tail t-test. (B) Co-immunoprecipitations for control IgG or anti-EZH2 antibodies were performed in nuclear lysates of colon epithelial cells from sham-inoculated mice (S) or ETBF-inoculated mice (E). Blots from one set of representative mice are depicted. (C) Using distal colon epithelial cells, ChIP was performed for IgG, EZH2, or DNMT1 and analyzed by quantitative PCR. The data presented is the mean of ChIP performed in samples from 3 sham and 3 ETBF mice +/− SEM. * p < 0.05 by one-sided t-test for the difference between the means. Values below the gene names are the expressed sequence tag (EST) counts for mouse intestine from the Unigene database. See also Figure S6.

Comment in

References

    1. Chatterjee A, Mambo E, Zhang Y, Deweese T, Sidransky D. Targeting of mutant hogg1 in mammalian mitochondria and nucleus: effect on cellular survival upon oxidative stress. BMC Cancer. 2006;6:235. - PMC - PubMed
    1. Easwaran HP, Van Neste L, Cope L, Sen S, Mohammad HP, Pageau GJ, Lawrence JB, Herman JG, Schuebel KE, Baylin SB. Aberrant silencing of cancer-related genes by CpG hypermethylation occurs independently of their spatial organization in the nucleus. Cancer Res. 2010;70:8015–8024. - PMC - PubMed
    1. Espada J, Ballestar E, Santoro R, Fraga MF, Villar-Garea A, Nemeth A, Lopez-Serra L, Ropero S, Aranda A, Orozco H, et al. Epigenetic disruption of ribosomal RNA genes and nucleolar architecture in DNA methyltransferase 1 (Dnmt1) deficient cells. Nucleic Acids Res. 2007;35:2191–2198. Epub 2007 Mar 2113. - PMC - PubMed
    1. Fan W, Luo J. SIRT1 regulates UV-induced DNA repair through deacetylating XPA. Mol Cell. 2010;39:247–258. - PubMed
    1. Federico A, Morgillo F, Tuccillo C, Ciardiello F, Loguercio C. Chronic inflammation and oxidative stress in human carcinogenesis. Int J Cancer. 2007;121:2381–2386. - PubMed

Publication types

MeSH terms

Associated data