. 2011 Nov 15;20(5):674-88.
doi: 10.1016/j.ccr.2011.10.015.

Inhibition of mitochondrial translation as a therapeutic strategy for human acute myeloid leukemia

Affiliations

Inhibition of mitochondrial translation as a therapeutic strategy for human acute myeloid leukemia

Marko Skrtić et al. Cancer Cell. .

Abstract

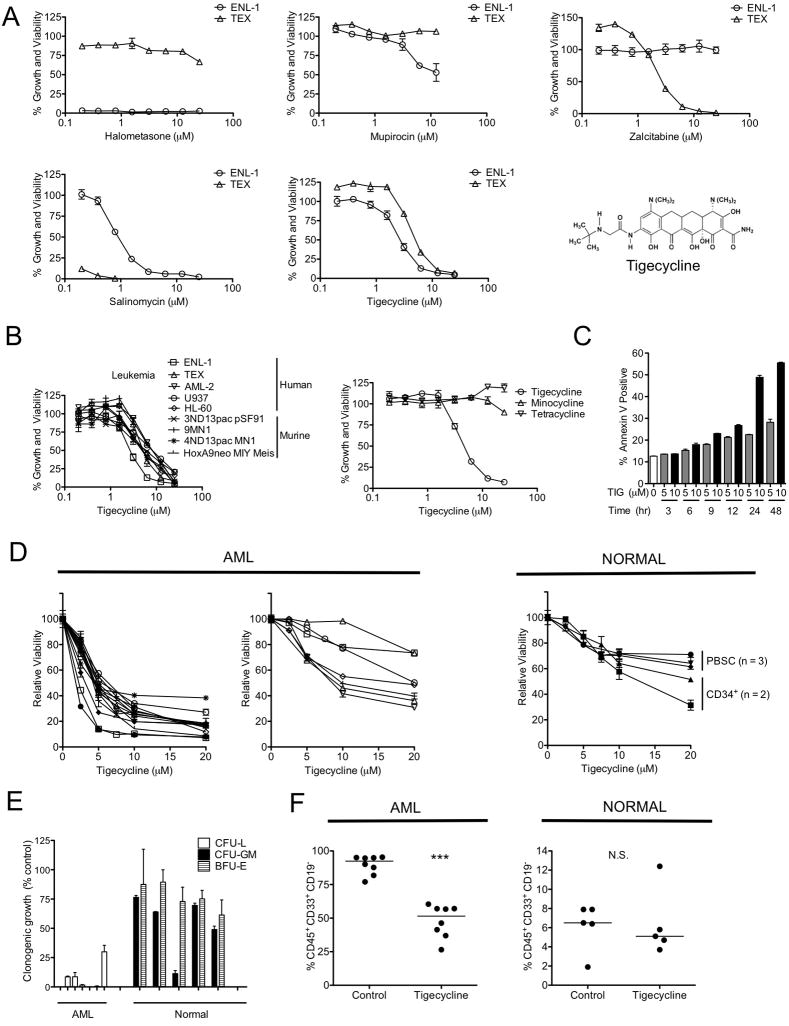
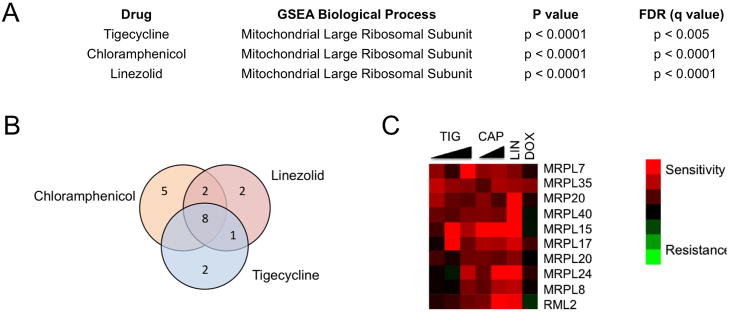
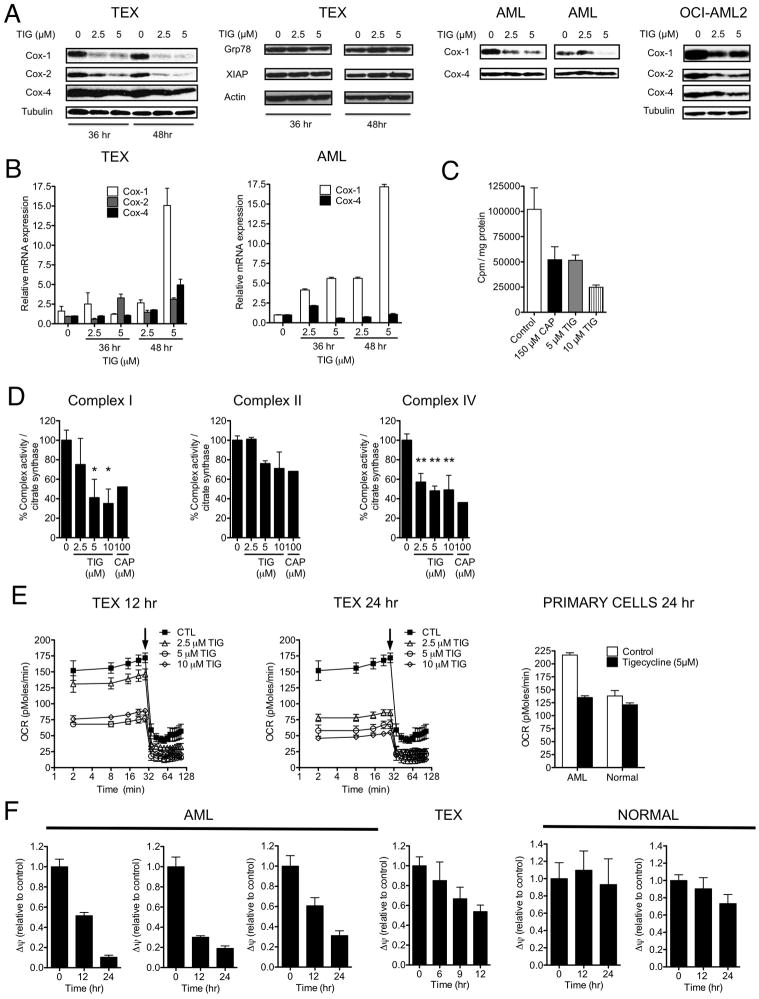
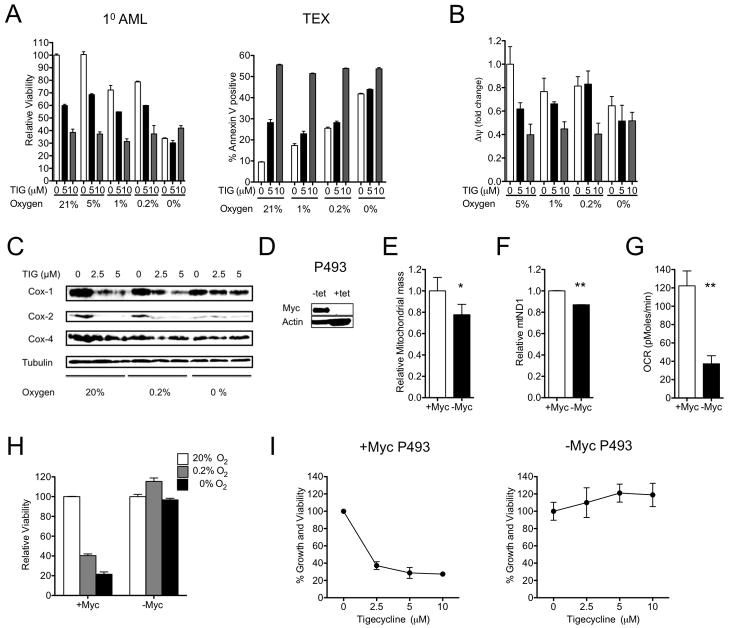
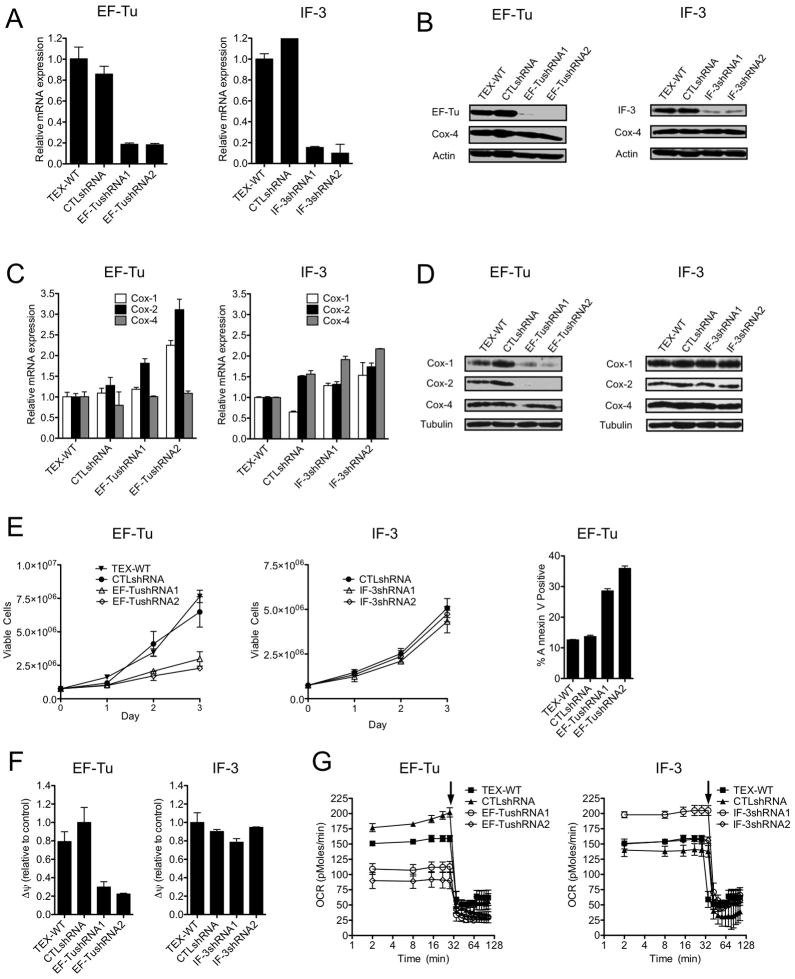
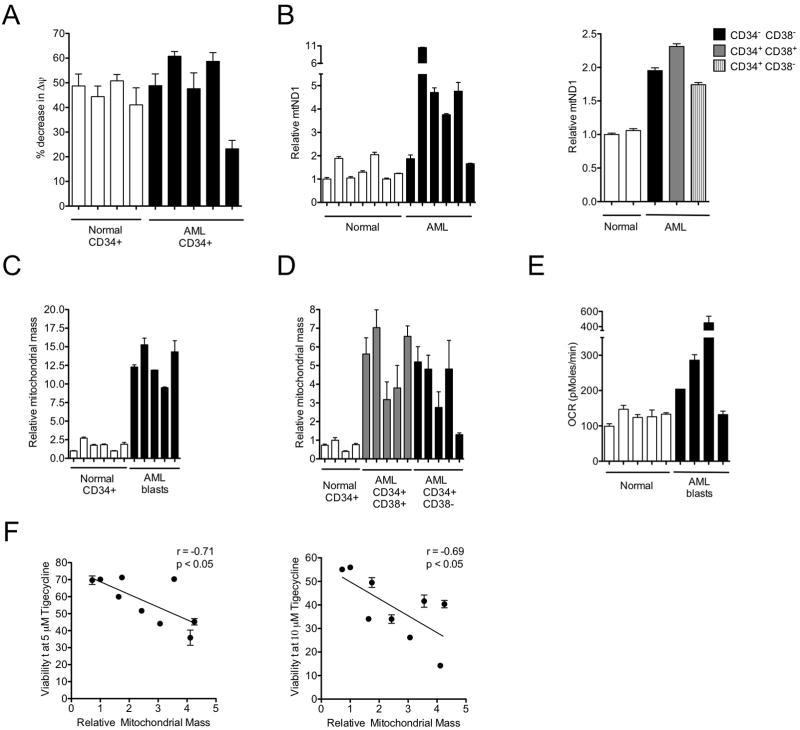
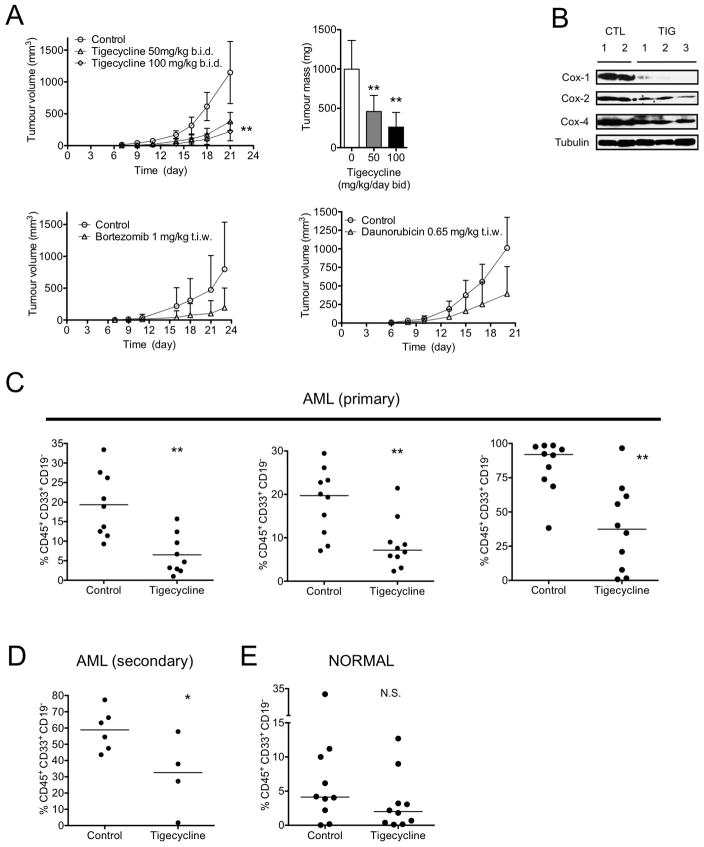
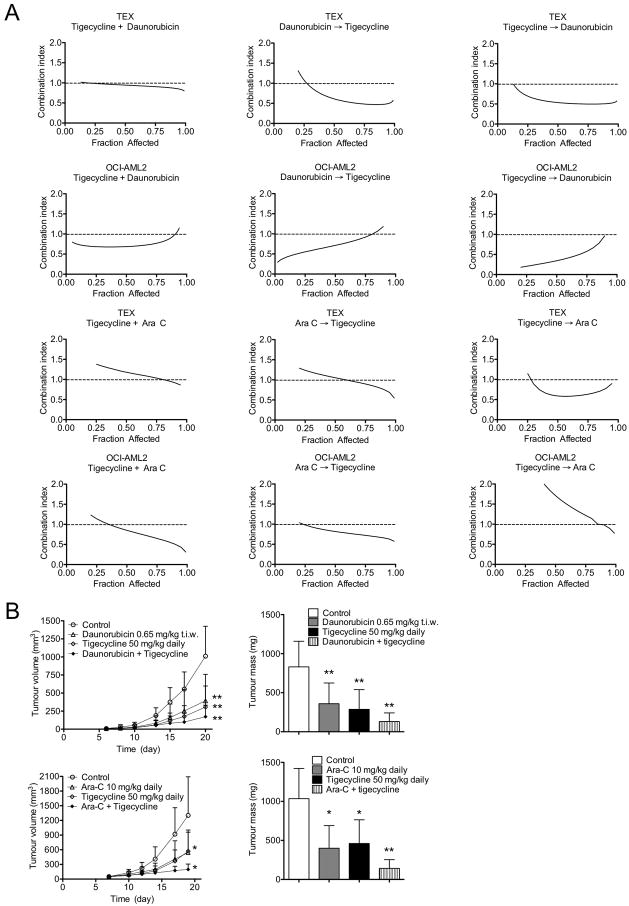
To identify FDA-approved agents targeting leukemic cells, we performed a chemical screen on two human leukemic cell lines and identified the antimicrobial tigecycline. A genome-wide screen in yeast identified mitochondrial translation inhibition as the mechanism of tigecycline-mediated lethality. Tigecycline selectively killed leukemia stem and progenitor cells compared to their normal counterparts and also showed antileukemic activity in mouse models of human leukemia. ShRNA-mediated knockdown of EF-Tu mitochondrial translation factor in leukemic cells reproduced the antileukemia activity of tigecycline. These effects were derivative of mitochondrial biogenesis that, together with an increased basal oxygen consumption, proved to be enhanced in AML versus normal hematopoietic cells and were also important for their difference in tigecycline sensitivity.


Figures

Figure 1
Figure 1. Chemical screen for compounds targeting leukemic cells identifies antimicrobial tigecycline
(A) Drugs were added to TEX and ENL-1 cells (3 experiments each). Viability of cells after 72 hrs was determined by MTS staining and the results expressed as a percent of matching DMSO-treated controls (B) TEX, human and murine leukemia cells were incubated in triplicate experiments with drugs at concentrations shown for 72 hrs and viability was determined by MTS (human cells) or ViaCount (murine cells) staining and results expressed as a percent of results for untreated cells. (C) TEX cells were exposed to 5 or 10 μM of tigecycline (TIG) and Annexin V staining by flow cytometry was used to discriminate viable cells. Data represent the mean of Annexin V positive cells from a representative experiment (n=3). (D) Primary AML (1° AML) (n=20) and normal hematopoietic cells (n=5) were treated with increasing concentrations of tigecycline for 48 hrs. The proportion of viable cells was measured by Annexin-PI flow cytometry to calculate the yield of viable cells shown as a percent viable DMSO-treated cells in the same experiment. (E) Primary AML (n=7) and normal hematopoietic cells (n=5) were treated with 5 μM tigecycline and plated in clonogenic growth assays. Values shown are the percent of colonies obtained compared to DMSO-treated cells. (F) Cells from an AML patient and Lin CD34+ enriched human cord blood cells were treated with 5 μM tigecycline or DMSO for 48 hrs in vitro and then injected into femurs of irradiated NOD/SCID mice preconditioned with anti-CD122. Six weeks later, the percent of human CD45+CD33+CD19 cells in femurs was measured by FACS. ***P < 0.0001, N.S. not significant P > 0.05 as determined by the unpaired student’s t test. Error bars represent mean +/− S.D. See also Table S1 and Figure S1.
Figure 2
Figure 2. Haplo-Insufficiency Profiling in S. Cerevisiae identifies mitochondrial translation as target of tigecycline in eukaryotic cells
(A) A pool of ~6000 S. Cerevisiae heterozygote mutant strains were cultured in the presence or absence of tigecycline, chloramphenicol (CAP), linezolid (LIN) or doxorubicin (DOX) in YPGE media and those showing altered growth responses relative to control cells identified. Gene Set Enrichment Analysis (GSEA) processes are shown. (B) Commonly enriched genes involved in mitochondrial translation identified from this GSEA analysis are shown in the Venn diagram (B) and the heat map (C). Red color denotes higher gene enrichment in the presence of drug relative to control cells. See also Figure S2.
Figure 3
Figure 3. Tigecycline inhibits mitochondrial protein translation
(A) Effects of increasing concentrations of tigecycline on protein levels of Cox-1, Cox-2, Cox-4, Grp78, XIAP, Actin and Tubulin in TEX, OCI-AML2 and 2 AML patients’ cells treated for 48 hrs. (B) Effects of increasing concentrations of tigecycline on Cox-1, Cox-2, and Cox-4 mRNA expression in TEX and AML patient cells treated for 48 hrs. Transcript levels were determined by quantitative RT-PCR and normalized relative to 18S. Data is shown as mean fold change compared to untreated controls (n=3). (C) Mitochondrial isolates from OCI-AML2 cells were treated with buffer control, tigecycline or chloramphenicol for 5 min at 30°C, followed by the addition of [3H]-leucine. Incorporation of [3H]-leucine was measured after 60 min. (D) Effect of increasing concentrations of tigecycline and chloramphenicol on Complex I, II and IV enzyme activities relative to citrate synthase activity in TEX cells treated for 72 hrs. Values shown are average of 3 independent experiments. *P < 0.05, ** P < 0.005, as determined by Tukey’s test after One-way ANOVA analysis. (E) Oxygen consumption was measured in TEX, AML patient and normal hematopoietic cells treated for 12 or 24 hrs with tigecycline. The arrow denotes addition of 1.2 μM oligomycin. Values shown are average of 3 independent experiments. (F) Effect of increasing concentrations of tigecycline on mitochondrial membrane potential (Δψ) in TEX, AML patients’ and normal hematopoietic cells treated for 12 or 24 hrs and then stained with JC-1 dye for flow cytometry. Shown are the average Red/Green ratios derived for tigecycline-treated cells expressed as a percent of that in DMSO-treated control cells from the same experiments (n=3 per cell type). Error bars represent mean +/− S.D. See also Figure S3.
Figure 4
Figure 4. Inhibition of mitochondrial translation is functionally important for tigecycline-induced death of leukemia cells
(A) TEX and primary AML cells were treated under different oxygen concentrations for 48 hrs. Viability (Annexin-PI) and mitochondrial membrane potential (B) (Δψ, Red/Green ratio of JC-1) were assessed by flow cytometry. Results are shown relative to DMSO treated control. (C) Total proteins were extracted from TEX cells and analyzed by immunoblotting for Cox1, Cox2, Cox4, and Tubulin. (D) P493 lymphoma cells carrying a tetracycline-repressible human Myc construct were cultured in the presence and absence of 0.1 μg/ml (0.22 μM) of tetracycline for 96 hrs. Total proteins were extracted and analyzed by immunoblotting for Myc and actin. (E) Mitochondrial mass was measured by incubating cells with mitotracker Green FM dye, and subsequent flow cytometry. Median fluorescence intensity is shown relative to wild-type p493 cells. (F) DNA was extracted from cells and qPCR was used to measure levels of mitochondrial ND1 relative to human globulin (HGB). ND1/HGB ratio is shown relative to wild-type p493 cells. (G) Oxygen consumption was measured and is shown after 15 min incubation in cell chambers. *P < 0.05, **P < 0.005 as determined by unpaired student’s t test. (H) P493 cells with or without repressed Myc were plated in different oxygen concentrations (20%, 0.2%, and 0%) for 72 hrs. The proportion of viable cells was measured by Annexin-PI flow cytometry and calculated as the percent of viable cells compared to 20% oxygen control condition. (I) P493 cells with or without repressed MYC were washed and then treated with increasing concentrations of tigecycline for 48 hrs. After treatment, the number of viable cells was determined by trypan blue staining. Data represent the mean number of viable cells from 1 of 3 independent experiments. Error bars represent mean +/− S.D.
Figure 5
Figure 5. Alternative genetic and chemical strategies to inhibit mitochondrial translation have anti-leukemia effects
(A) TEX cells were infected with EF-Tu or IF-3 targeting shRNAs or control sequences in lentiviral vectors. Six days post-transduction, EF-Tu and IF-3 mRNA expression relative to 18S (A) and protein expression determinations (B) were made by qRT-PCR and immunoblotting, respectively. (C) Effects on mRNA expression of Cox-1, Cox-2, Cox-4 and Tubulin were determined by q-RT-PCR using 18S RNA as an internal standard (1 of 3 representative experiments shown). (D) Effects on expression of Cox-1, Cox-2, Cox-4 and Tubulin protein were determined by immunoblotting (a representative experiment is shown). (E) Viable cells were measured by trypan blue staining and cell death by Annexin-V staining. Data from 1 of 3 independent experiments are shown. Additional cells treated in the same way were used to measure effects on other parameters. (F) Effects on mitochondrial membrane potential (Δψ) were determined by staining cells with the JC-1 dye and then determining Red/Green ratios by flow cytometric analysis. (G) Effects on oxygen consumption were determined as described in the supplemental experimental procedures. Arrow denotes addition of 1.2 μM oligomycin. Results for 1 of 2 experiments with similar outcomes are shown. Error bars represent mean +/− S.D. See also Figure S4.
Figure 6
Figure 6. Mitochondrial characteristics of AML and normal hematopoietic cells
(A) Baseline mitochondrial membrane potential values for AML and normal CD34+ cells before and after uncoupling the potential with CCCP, as determined by staining the cells with DilC1 (5). (B) Left panel shows mitochondrial DNA copy number determined in 7 AML patients and 6 normal hematopoietic samples. Right panel shows mitochondrial DNA copy number determined in a primary AML sample after CD34+ and CD38+ fluorescence-activated cell sorting and 2 normal hematopoietic samples. DNA was extracted from cells and qPCR was performed for mitochondrial ND1 relative to human globulin (HGB). The ND1/HGB ratio is shown relative to cells from one normal sample. (C) Mitochondrial mass values for AML blasts (C), CD34+/CD38+ cells and CD34+/CD38 cells (D) and normal CD34+ cells were determined by flow cytometric analysis of cells stained with Mitotracker Green FM. Median fluorescence intensity (MFI) values are shown by comparison to the MFI measured for one of the normal samples. (E) Comparison of resting oxygen consumption rates of primary AML cells (n=4) and normal hematopoietic cells (n=5). (F) Correlation analysis of mitochondrial mass (Mitotracker Green FM staining) and in vitro toxicity to tigecycline (Annexin-V/PI staining) of primary AML cells (n=11) based on results obtained at doses of 5 and 10 μM. *P < 0.05, as determined by Pearson correlation coefficient. Error bars represent mean +/− S.D.
Figure 7
Figure 7. Tigecycline has in vivo activity in models of human leukemia in mice
(A) Human leukemia (OCI-AML2) cells were injected subcutaneously into the flank of SCID mice. Seven days later, when tumors were palpable, mice were treated with tigecycline (50 mg/kg or 100 mg/kg twice daily by i.p. injection), bortezomib (1 mg/kg t.i.w.), daunorubicin (0.65 mg/kg t.i.w.) or vehicle control (n = 10 per group). Three weeks after injection of cells, mice were sacrificed, tumors excised and the volume and mass of the tumors were measured. The tumor mass and the mean volume are shown. **P < 0.005, as determined by Tukey’s test after one-way ANOVA analysis. (B) Tumors from two control mice, and three tigecycline-treated mice were excised after 5 days of treatment and total proteins were extracted and analyzed by immunoblotting for Cox-1, Cox-2, Cox-4, and tubulin. (C) Primary cells from 3 AML patients and Lin CD34+ enriched human cord blood cells (E) (Normal) were injected intra-femorally into irradiated female NOD/SCID mice. Three weeks after injection, the mice were treated with tigecycline (100 mg/kg by i.p. injection daily) or vehicle control (n = 10 per group) for three weeks. Following treatment, human leukemia cell engraftment in the femur was measured by flow cytometric analysis of human CD45+CD19CD33+ cells. **P < 0.005 as determined by student’s t test. (D) Cells from mice transplanted with one AML patient experiment were used to assess secondary engraftment in a second generation of NOD/SCID mice. Equal numbers of viable leukemia cells from the bone marrow of control and tigecycline-treated mice were pooled and aliquots injected into irradiated NOD/SCID mice, which were not treated with tigecycline. Six weeks later, human leukemia cell engraftment in the femur was measured by flow cytometric analysis for human CD45+CD19CD33+ cells. Line represents median of engrafted human cells. *P < 0.05, N.S. not significant P > 0.05 as determined by student’s t test. Error bars represent mean +/− S.D. See also Figure S5.
Figure 8
Figure 8. Tigecycline has in vivo anti-leukemia activity in combination with AML agents daunorubicin and cytarabine
(A) The effect of a 72 hour exposure of TEX and OCI-AML2 cells to different concentrations of tigecycline in combination with daunorubicin or cytarabine on the viability of the cells was measured by MTS assay after 72 hours of incubation. Data were analyzed with Calcusyn software to generate a Combination index versus Fractional effect (cell death) plot showing the effect of the combination of tigecycline with daunorubicin or cytarabine. CI < 1 indicates synergism. (B) Human leukemia (OCI-AML2) cells were injected subcutaneously into the flank of SCID mice. Six days after injection, when tumors were palpable, mice were treated with tigecycline (50 mg/kg daily by i.p. injection) and/or daunorubicin (0.65 mg/kg t.i.w. by i.p. injection) and/or cytarabine (10 mg/kg daily by i.p. injection) or vehicle control (7 mice per treatment group). Another 2 weeks later, mice were sacrificed, tumors excised and the volume and mass of the tumors were measured and mean values determined. The tumor mass and the mean volume are shown. *P < 0.05, ** P < 0.005, as determined by Tukey’s test after One-way ANOVA analysis. Error bars represent mean +/− S.D. See also Figure S6.

Comment in

References

    1. Barabé F, Kennedy JA, Hope KJ, Dick JE. Modeling the initiation and progression of human acute leukemia in mice. Science. 2007:600–604. - PubMed
    1. Bonnet D, Dick JE. Human acute myeloid leukemia is organized as a hierarchy that originates from a primitive hematopoietic cell. Nat Med. 1997:730–737. - PubMed
    1. Capps GJ, Samuels DC, Chinnery PF. A model of the nuclear control of mitochondrial DNA replication. J Theor Biol. 2003:565–583. - PubMed
    1. Christian BE, Spremulli LL. Evidence for an active role of IF3mt in the initiation of translation in mammalian mitochondria. Biochemistry. 2009:3269–3278. - PMC - PubMed
    1. Chrzanowska-Lightowlers ZM, Preiss T, Lightowlers RN. Inhibition of mitochondrial protein synthesis promotes increased stability of nuclear-encoded respiratory gene transcripts. J Biol Chem. 1994:27322–27328. - PubMed

Publication types