

Magnitude and regulation of bacterioplankton respiratory quotient across freshwater environmental gradients
- PMID: 22094347
- PMCID: PMC3329109
- DOI: 10.1038/ismej.2011.157
Magnitude and regulation of bacterioplankton respiratory quotient across freshwater environmental gradients
Abstract
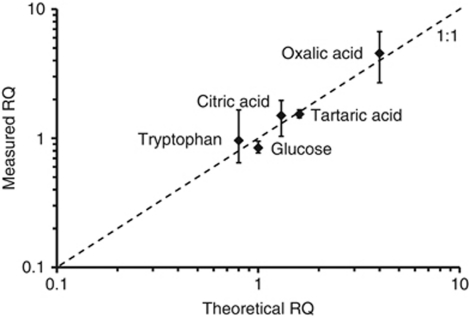
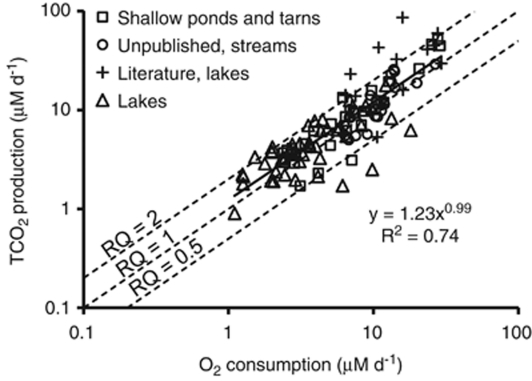
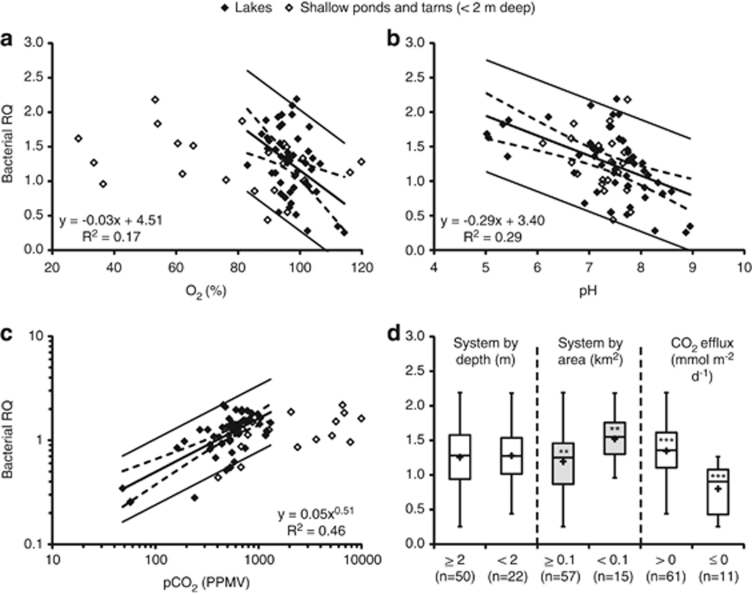
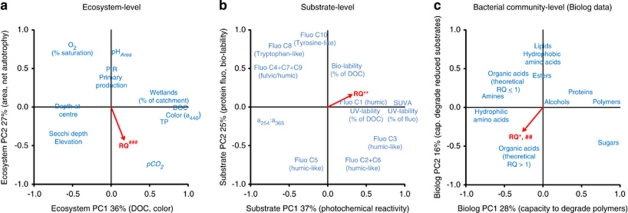
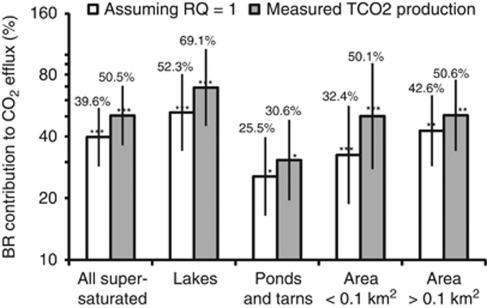
Bacterioplankton respiration (BR) may represent the largest single sink of organic carbon in the biosphere and constitutes an important driver of atmospheric carbon dioxide (CO(2)) emissions from freshwaters. Complete understanding of BR is precluded by the fact that most studies need to assume a respiratory quotient (RQ; mole of CO(2) produced per mole of O(2) consumed) to calculate rates of BR. Many studies have, without clear support, assumed a fixed RQ around 1. Here we present 72 direct measurements of bacterioplankton RQ that we carried out in epilimnetic samples of 52 freshwater sites in Québec (Canada), using O(2) and CO(2) optic sensors. The RQs tended to converge around 1.2, but showed large variability (s.d.=0.45) and significant correlations with major gradients of ecosystem-level, substrate-level and bacterial community-level characteristics. Experiments with natural bacterioplankton using different single substrates suggested that RQ is intimately linked to the elemental composition of the respired compounds. RQs were on average low in net autotrophic systems, where bacteria likely were utilizing mainly reduced substrates, whereas we found evidence that the dominance of highly oxidized substrates, for example, organic acids formed by photo-chemical processes, led to high RQ in the more heterotrophic systems. Further, we suggest that BR contributes to a substantially larger share of freshwater CO(2) emissions than presently believed based on the assumption that RQ is ∼1. Our study demonstrates that bacterioplankton RQ is not only a practical aspect of BR determination, but also a major ecosystem state variable that provides unique information about aquatic ecosystem functioning.
Figures
References
-
- Anderson LA. On the hydrogen and oxygen-content of marine phytoplankton. Deep Sea Res Part-I Oceanogr Res. 1995;42:1675–1680.
-
- Bastviken D, Cole JJ, Pace ML, Van de Bogert MC. Fates of methane from different lake habitats: connecting whole-lake budgets and CH4 emissions. J GeophysRes-Biogeosci. 2008;113:13.
-
- Battin TJ, Luyssaert S, Kaplan LA, Aufdenkampe AK, Richter A, Tranvik LJ. The boundless carbon cycle. Nat Geosci. 2009;2:598–600.
-
- Berdalet E, Packard T, Lagace B, Roy S, StAmand L, Gagne JP. CO2 production, O-2 consumption and isocitrate dehydrogenase in the marine bacterium Vibrio natriegens. Aqua Microbial Ecol. 1995;9:211–217.
-
- Berggren M, Laudon H, Haei M, Ström L, Jansson M. Efficient aquatic bacterial metabolism of dissolved low molecular weight compounds from terrestrial sources. ISME J. 2010;4:408–416. - PubMed
Publication types
MeSH terms
Substances
LinkOut - more resources
Full Text Sources
Other Literature Sources
