Comparative Study
. 2012 Feb;35(2):441-8.
doi: 10.1002/jmri.23506. Epub 2011 Nov 16.

Comparison of a 28-channel receive array coil and quadrature volume coil for morphologic imaging and T2 mapping of knee cartilage at 7T

Affiliations
Comparative Study

Comparison of a 28-channel receive array coil and quadrature volume coil for morphologic imaging and T2 mapping of knee cartilage at 7T

Gregory Chang et al. J Magn Reson Imaging. 2012 Feb.

Erratum in

  • J Magn Reson Imaging. 2012 Apr;35(4):993

Abstract

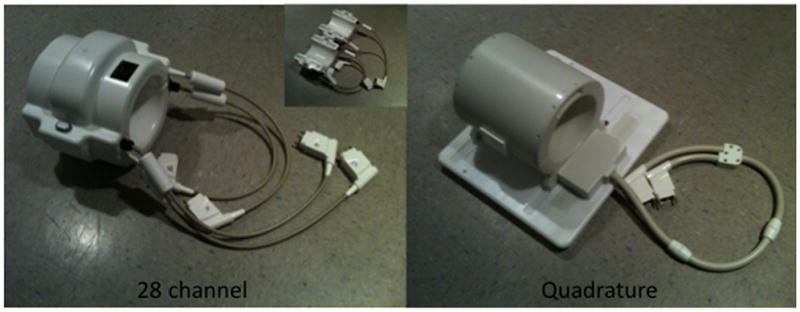
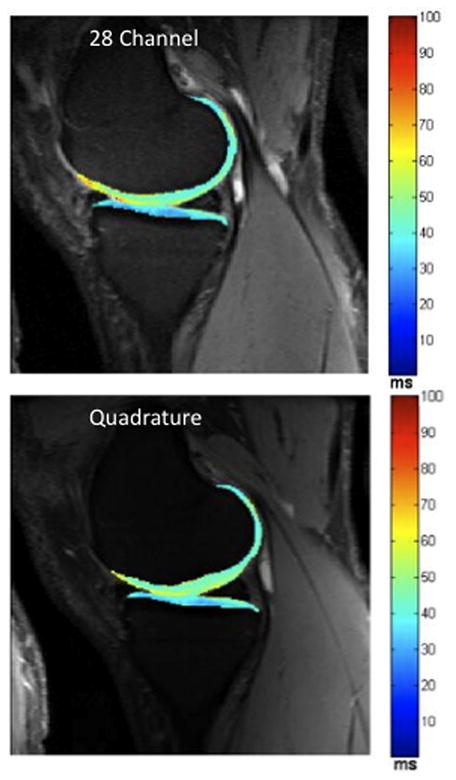
Purpose: To compare a new birdcage-transmit, 28-channel receive array (28-Ch) coil and a quadrature volume coil for 7T morphologic MRI and T2 mapping of knee cartilage.

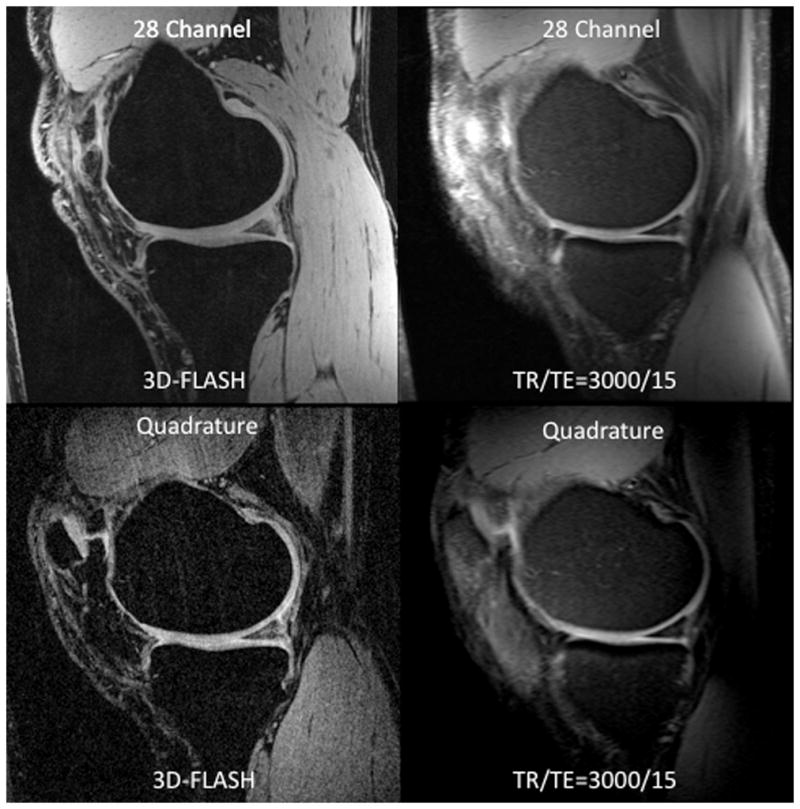
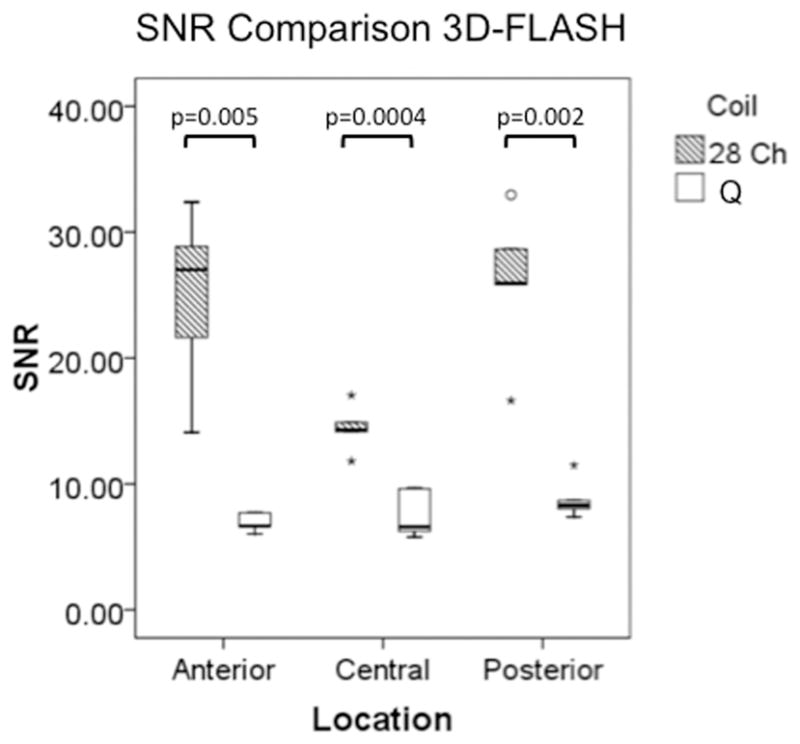
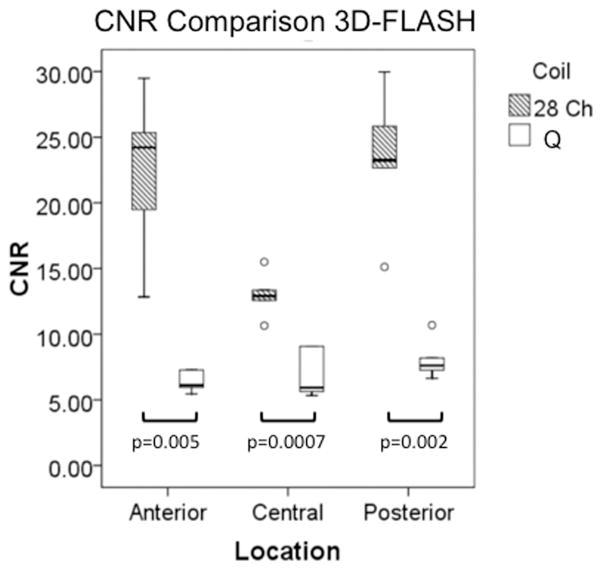
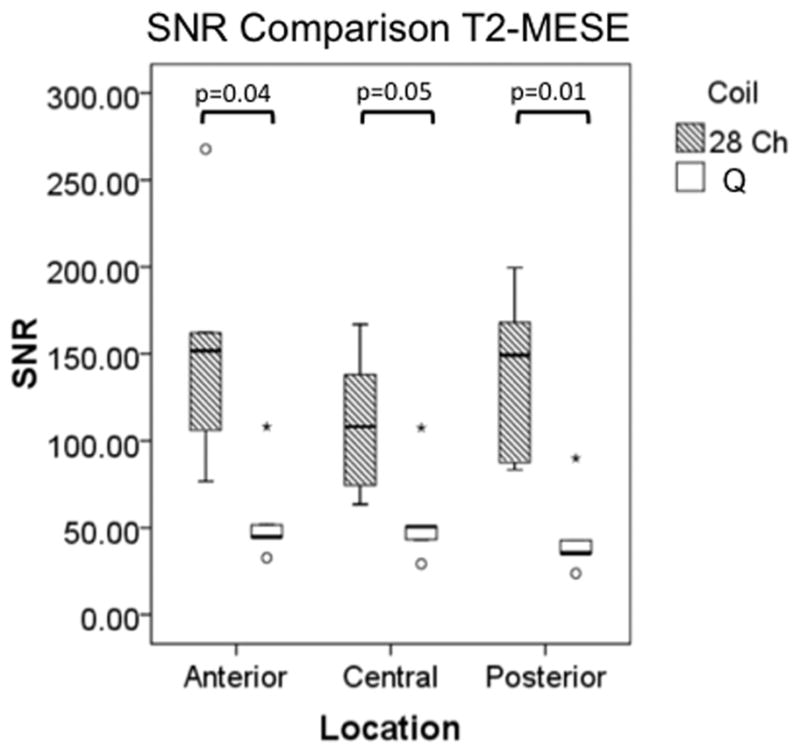
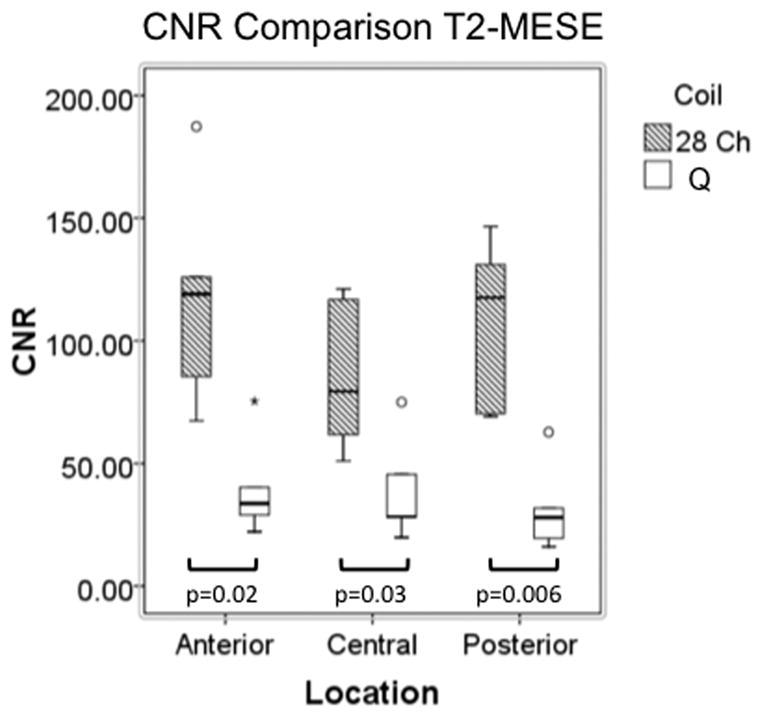
Materials and methods: The right knees of 10 healthy subjects were imaged on a 7T whole body magnetic resonance (MR) scanner using both coils. 3D fast low-angle shot (3D-FLASH) and multiecho spin-echo (MESE) sequences were implemented. Cartilage signal-to-noise ratio (SNR), contrast-to-noise ratio (CNR), thickness, and T2 values were assessed.

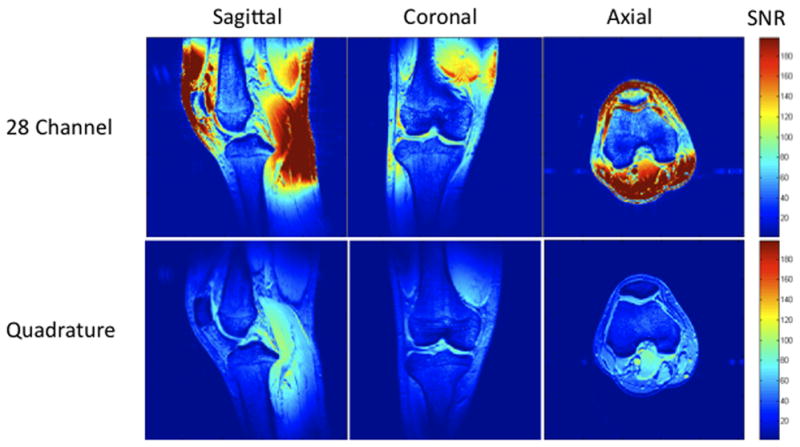
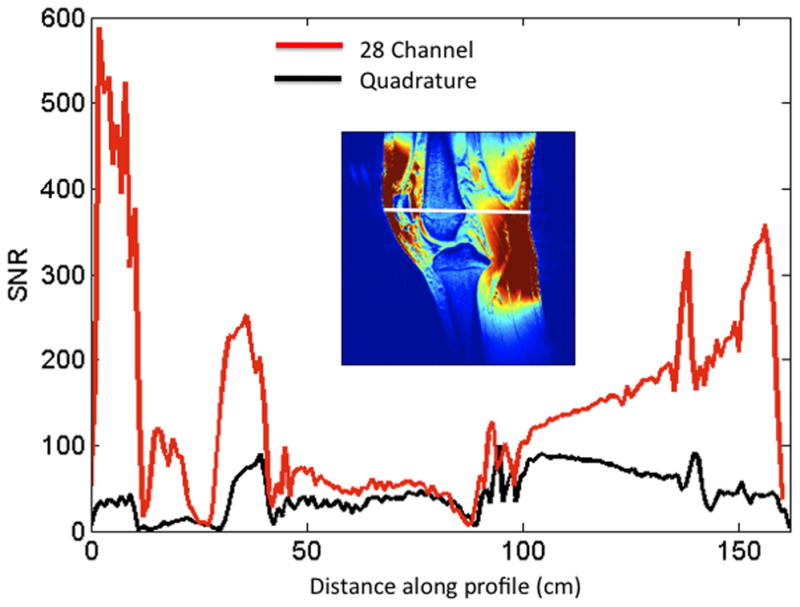
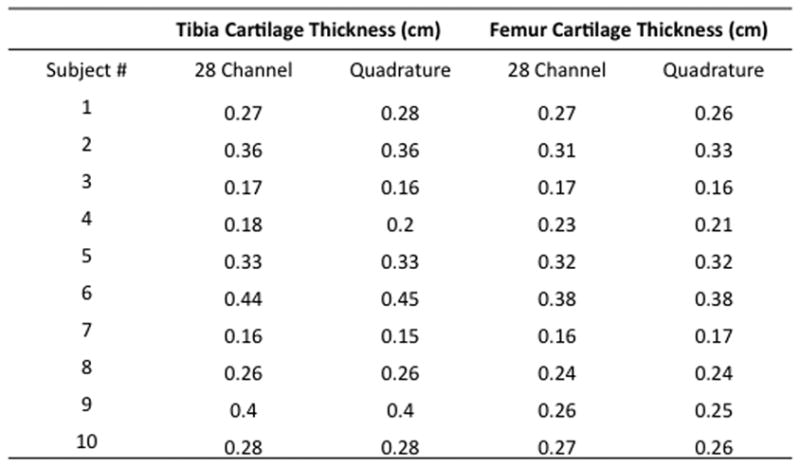
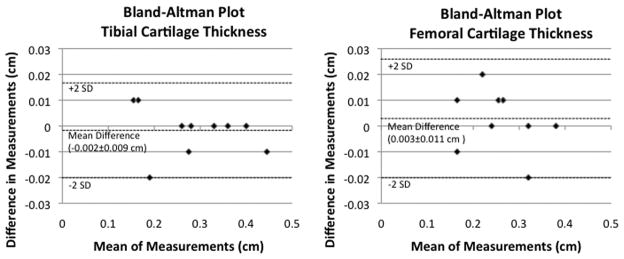
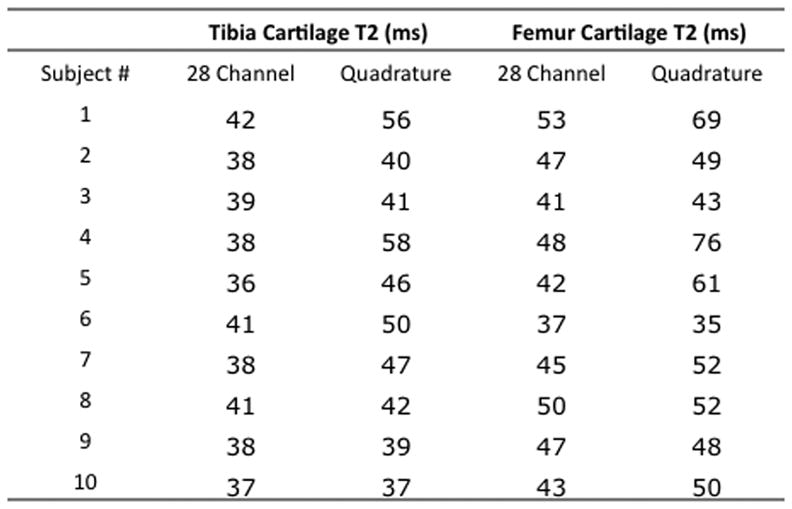
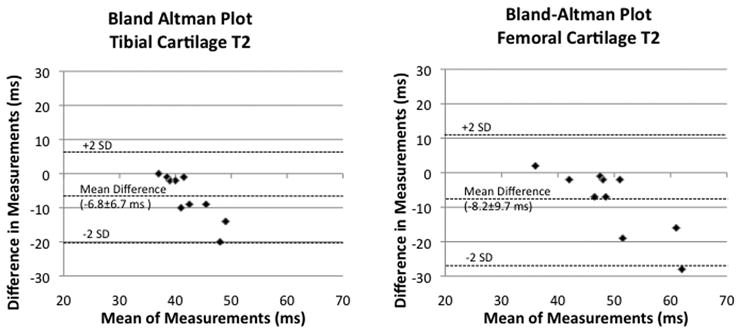
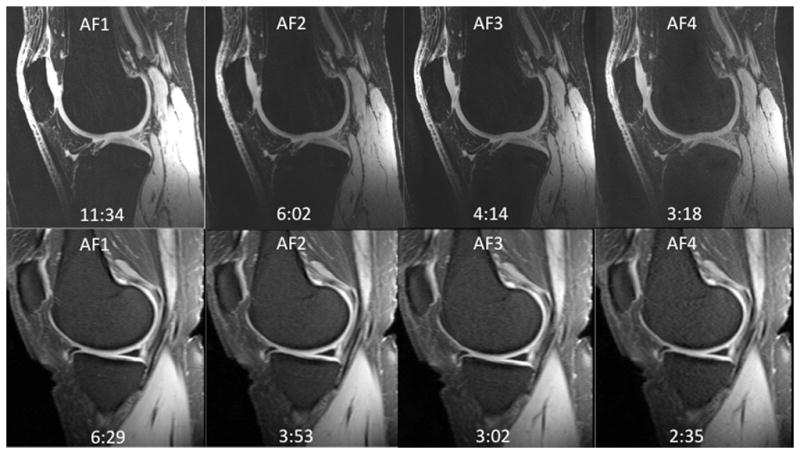
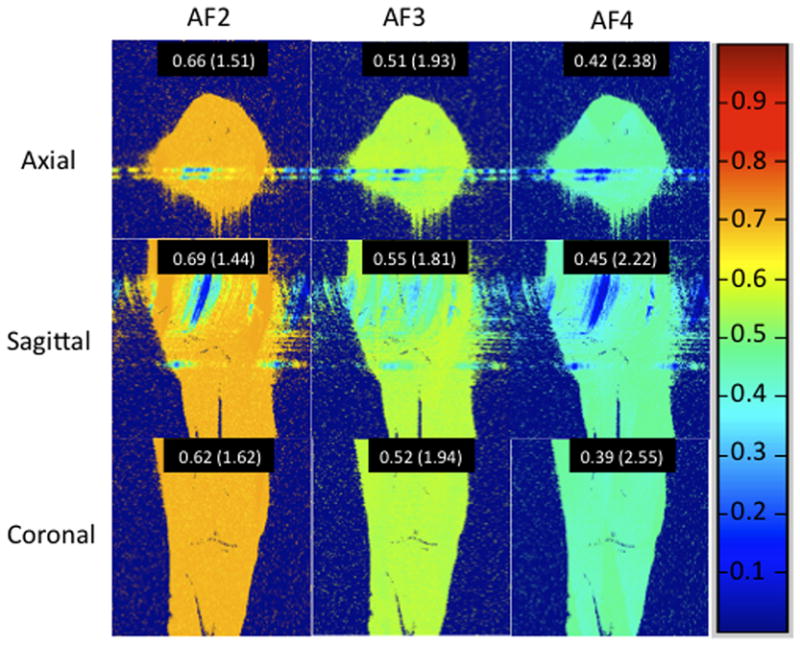
Results: SNR/CNR was 17%-400% greater for the 28-Ch compared to the quadrature coil (P ≤ 0.005). Bland-Altman plots show mean differences between measurements of tibial/femoral cartilage thickness and T2 values obtained with each coil to be small (-0.002 ± 0.009 cm / 0.003 ± 0.011 cm) and large (-6.8 ± 6.7 msec/-8.2 ± 9.7 msec), respectively. For the 28-Ch coil, when parallel imaging with acceleration factors (AF) 2, 3, and 4 was performed SNR retained was: 62%-69%, 51%-55%, and 39%-45%.

Conclusion: A 28-Ch knee coil provides increased SNR/CNR for 7T cartilage morphologic imaging and T2 mapping. Coils should be switched with caution during clinical studies because T2 values may differ. The greater SNR of the 28-Ch coil could be used to perform parallel imaging with AF2 and obtain similar SNR as the quadrature coil.


Figures

Figure 1
Figure 1
(a–c). (a) Images of the 28 channel coil (left) and quadrature coil (right). The 28 channel coil consists of anterior and posterior halves, each of which contains 14 receive elements (inset image). (b) SNR maps of the 28 channel coil versus the quadrature volume coil in sagittal, coronal, and axial planes. These maps were generated using the sum-of-squares method from estimates of noise covariance and sensitivities for each coil. (c) SNR profile for the sagittal acquisition showing approximately 300–400% increase in SNR at the periphery of the field of view and approximately 17% increase in SNR at the center of the field of view.
Figure 1
Figure 1
(a–c). (a) Images of the 28 channel coil (left) and quadrature coil (right). The 28 channel coil consists of anterior and posterior halves, each of which contains 14 receive elements (inset image). (b) SNR maps of the 28 channel coil versus the quadrature volume coil in sagittal, coronal, and axial planes. These maps were generated using the sum-of-squares method from estimates of noise covariance and sensitivities for each coil. (c) SNR profile for the sagittal acquisition showing approximately 300–400% increase in SNR at the periphery of the field of view and approximately 17% increase in SNR at the center of the field of view.
Figure 2
Figure 2
(a–b). (a) Representative sagittal 7 T MR images from a volunteer obtained with the 28 channel coil (top row) and the quadrature coil (bottom row) using the 3D-FLASH sequence (left column) and from the first echo of the T2 multi-echo spin-echo sequence (right column). (b) Corresponding T2 maps from the same volunteer obtained with the 28 channel coil (top) and the quadrature coil (bottom).
Figure 2
Figure 2
(a–b). (a) Representative sagittal 7 T MR images from a volunteer obtained with the 28 channel coil (top row) and the quadrature coil (bottom row) using the 3D-FLASH sequence (left column) and from the first echo of the T2 multi-echo spin-echo sequence (right column). (b) Corresponding T2 maps from the same volunteer obtained with the 28 channel coil (top) and the quadrature coil (bottom).
Figure 3
Figure 3
(a–d). Boxplots comparing SNR and CNR with adjacent subchondral bone in the anterior, central, and posterior locations for the 28 channel (28 Ch) coil and the quadrature (Q) coil for both the 3D-FLASH and the T2 multi-echo spin-echo (T2-MESE) sequence. For the T2-MESE sequence, the earliest TE was used to calculate SNR and CNR. For the 3D-FLASH sequence and for the T2-MESE sequence, SNR (a, c) and CNR (b, d) were greater in the 28 channel coil compared to the quadrature coil (p ≤ 0.05 for all).
Figure 3
Figure 3
(a–d). Boxplots comparing SNR and CNR with adjacent subchondral bone in the anterior, central, and posterior locations for the 28 channel (28 Ch) coil and the quadrature (Q) coil for both the 3D-FLASH and the T2 multi-echo spin-echo (T2-MESE) sequence. For the T2-MESE sequence, the earliest TE was used to calculate SNR and CNR. For the 3D-FLASH sequence and for the T2-MESE sequence, SNR (a, c) and CNR (b, d) were greater in the 28 channel coil compared to the quadrature coil (p ≤ 0.05 for all).
Figure 4
Figure 4
(a–d). (a) Tibial and femoral cartilage thickness measurements (cm) obtained with the 28 channel and quadrature coil for all subjects. (b) Bland-Altman plots show small differences in measurements of cartilage thickness made with the 28 channel coil and quadrature coil. (c) Tibial and femoral cartilage T2 values (ms) obtained with the 28 channel and quadrature coil for all subjects. (d) Bland-Altman plots show large differences in measurements of cartilage T2 values made with the 28 channel and quadrature coil.
Figure 4
Figure 4
(a–d). (a) Tibial and femoral cartilage thickness measurements (cm) obtained with the 28 channel and quadrature coil for all subjects. (b) Bland-Altman plots show small differences in measurements of cartilage thickness made with the 28 channel coil and quadrature coil. (c) Tibial and femoral cartilage T2 values (ms) obtained with the 28 channel and quadrature coil for all subjects. (d) Bland-Altman plots show large differences in measurements of cartilage T2 values made with the 28 channel and quadrature coil.
Figure 5
Figure 5
(a–b). (a) 7T knee cartilage imaging using the 28 channel coil with acceleration factor (AF) of 1 (no acceleration) through 4. (b) Inverse geometry-factor (g-factor) maps, demonstrating the proportion of SNR retained at each AF. Mean values for inverse g-factors are shown for each acceleration, with g-factor values shown in parentheses.
Figure 5
Figure 5
(a–b). (a) 7T knee cartilage imaging using the 28 channel coil with acceleration factor (AF) of 1 (no acceleration) through 4. (b) Inverse geometry-factor (g-factor) maps, demonstrating the proportion of SNR retained at each AF. Mean values for inverse g-factors are shown for each acceleration, with g-factor values shown in parentheses.

References

    1. Regatte RR, Schweitzer ME. Ultra-high-field MRI of the musculoskeletal system at 7.0T. J Magn Reson Imaging. 2007 Feb;25(2):262–9. - PubMed
    1. Gold GE, Suh B, Sawyer-Glover A, Beaulieu C. Musculoskeletal MRI at 3.0 T: initial clinical experience. AJR Am J Roentgenol. 2004 Nov;183(5):1479–86. - PubMed
    1. Krug R, Stehling C, Kelley DA, Majumdar S, Link TM. Imaging of the musculoskeletal system in vivo using ultra-high field magnetic resonance at 7 T. Invest Radiol. 2009 Sep;44(9):613–8. - PubMed
    1. Roemer PB, Edelstein WA, Hayes CE, Souza SP, Mueller OM. The NMR phased array. Magn Reson Med. 1990 Nov;16(2):192–225. - PubMed
    1. Constantinides CD, Atalar E, McVeigh ER. Signal-to-noise measurements in magnitude images from NMR phased arrays. Magn Reson Med. 1997 Nov;38(5):852–7. - PMC - PubMed

Publication types