. 2012 Apr;55(4):1070-82.
doi: 10.1002/hep.24783. Epub 2012 Feb 9.

Endoplasmic reticulum-tethered transcription factor cAMP responsive element-binding protein, hepatocyte specific, regulates hepatic lipogenesis, fatty acid oxidation, and lipolysis upon metabolic stress in mice

Affiliations

Endoplasmic reticulum-tethered transcription factor cAMP responsive element-binding protein, hepatocyte specific, regulates hepatic lipogenesis, fatty acid oxidation, and lipolysis upon metabolic stress in mice

Chunbin Zhang et al. Hepatology. 2012 Apr.

Abstract

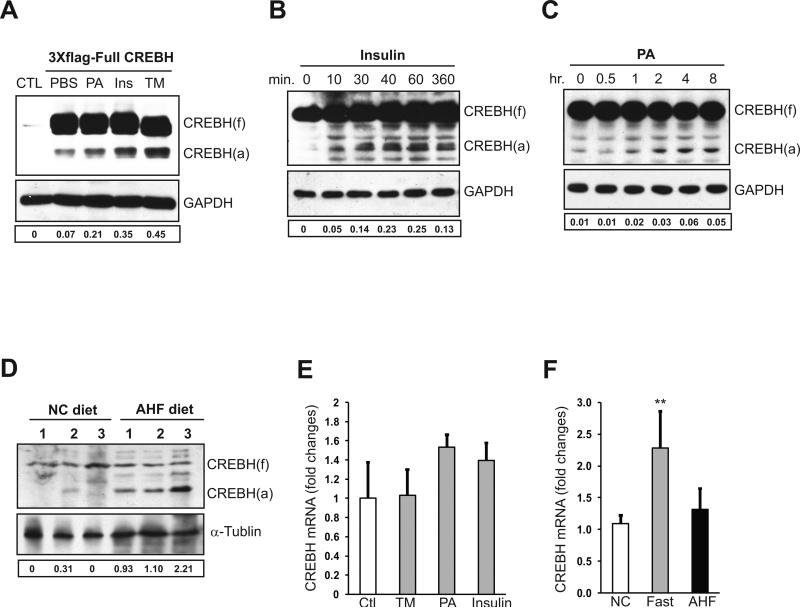
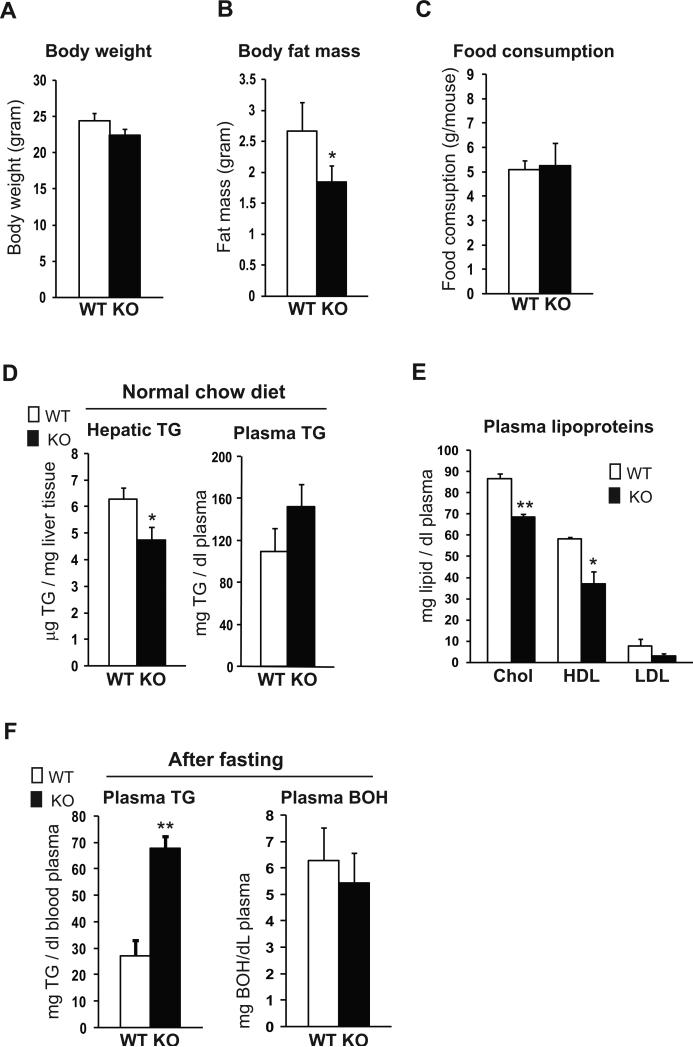
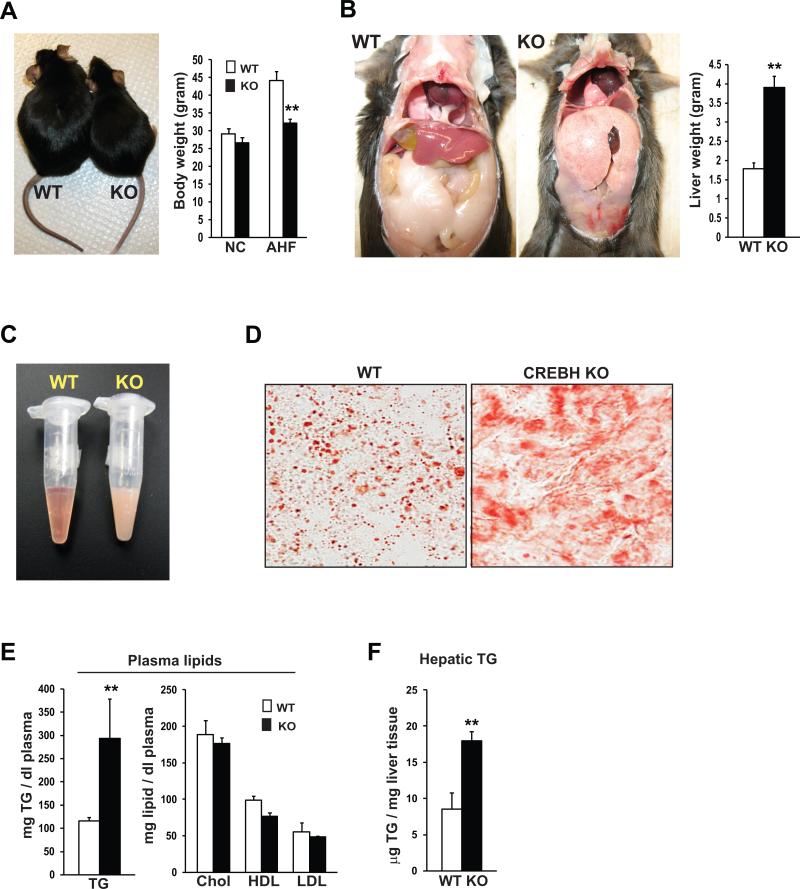
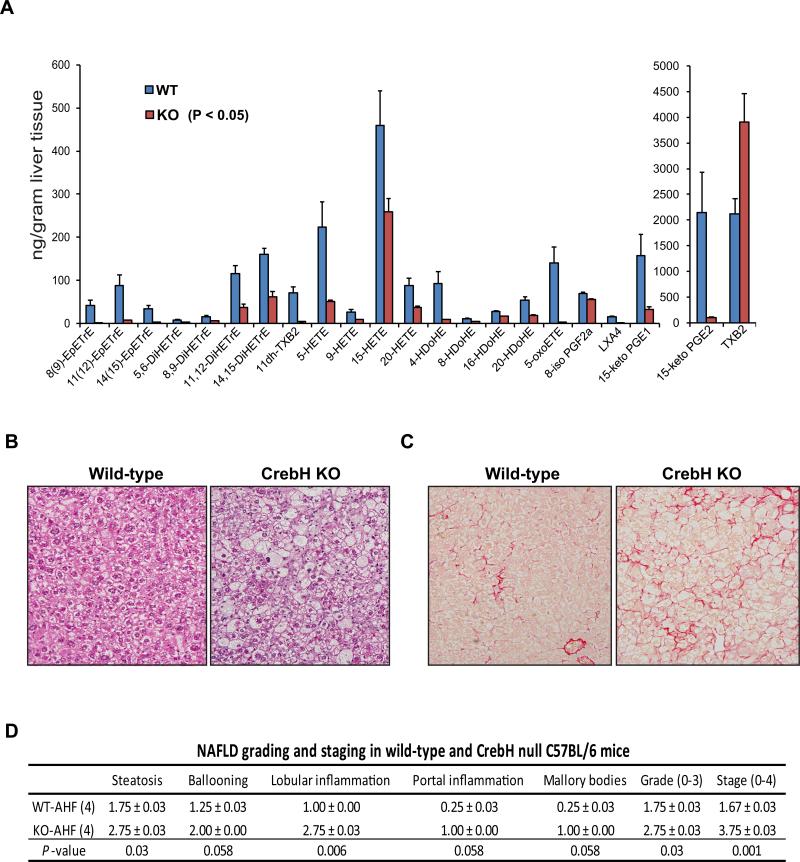
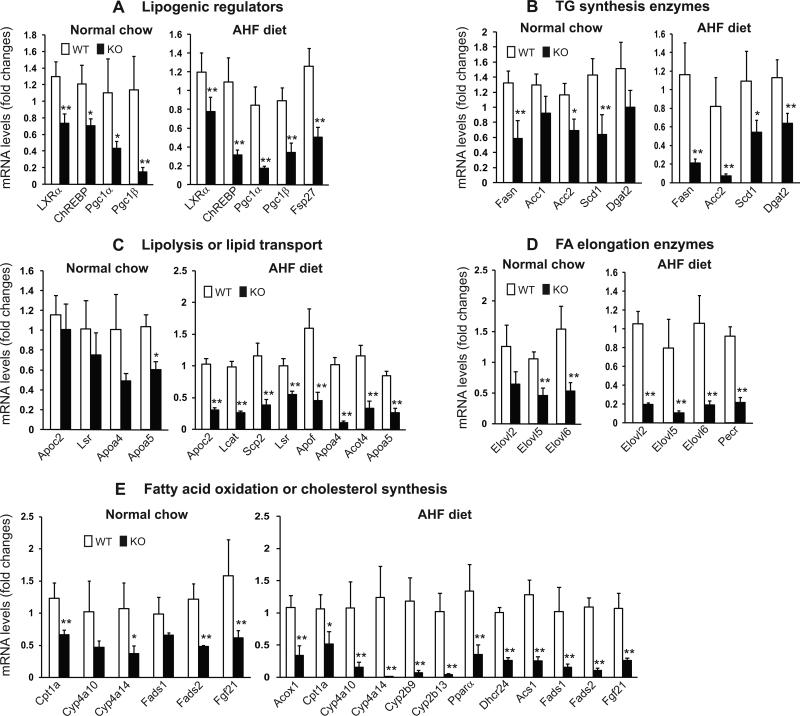
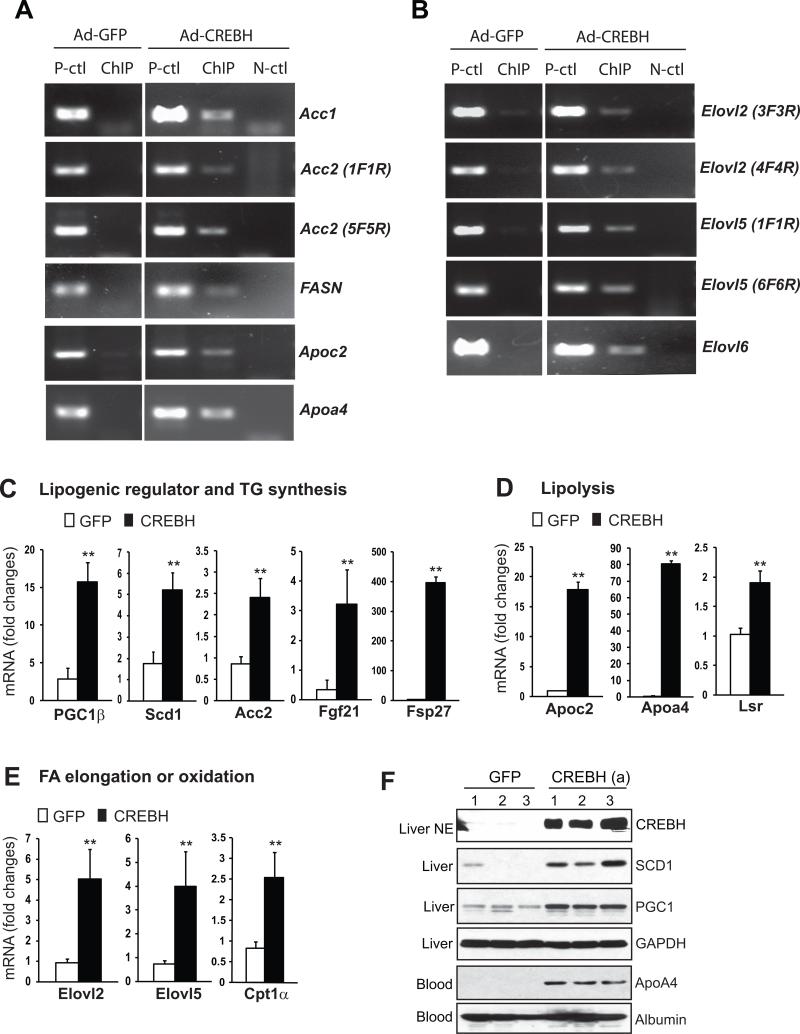
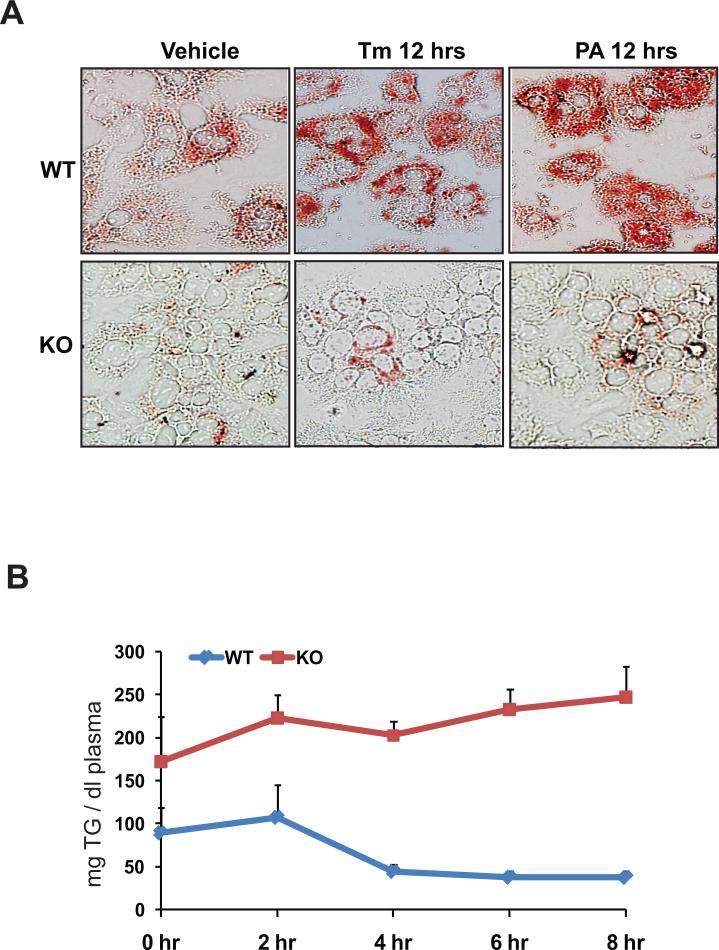
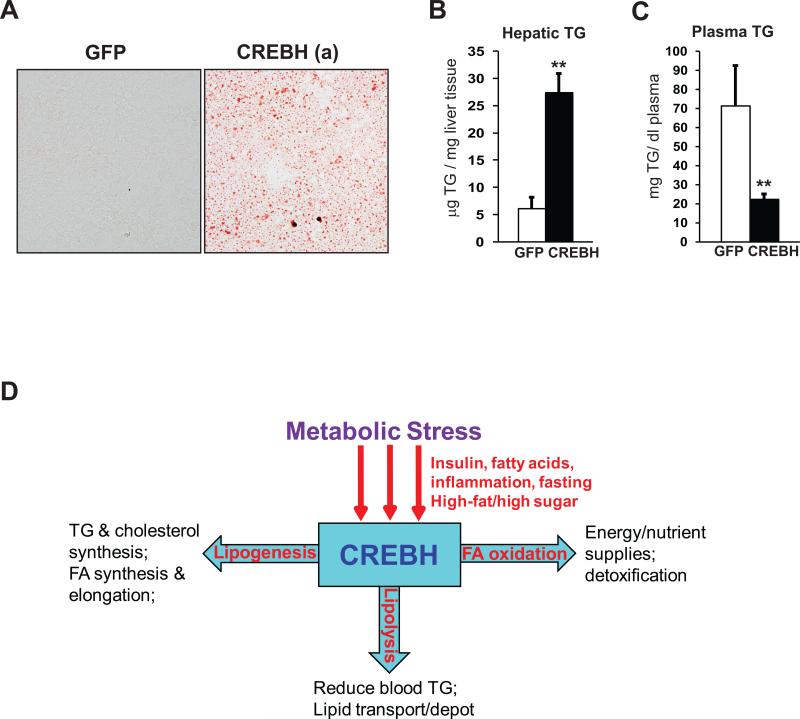
cAMP responsive element-binding protein, hepatocyte specific (CREBH), is a liver-specific transcription factor localized in the endoplasmic reticulum (ER) membrane. Our previous work demonstrated that CREBH is activated by ER stress or inflammatory stimuli to induce an acute-phase hepatic inflammation. Here, we demonstrate that CREBH is a key metabolic regulator of hepatic lipogenesis, fatty acid (FA) oxidation, and lipolysis under metabolic stress. Saturated FA, insulin signals, or an atherogenic high-fat diet can induce CREBH activation in the liver. Under the normal chow diet, CrebH knockout mice display a modest decrease in hepatic lipid contents, but an increase in plasma triglycerides (TGs). After having been fed an atherogenic high-fat (AHF) diet, massive accumulation of hepatic lipid metabolites and significant increase in plasma TG levels were observed in the CrebH knockout mice. Along with the hypertriglyceridemia phenotype, the CrebH null mice displayed significantly reduced body-weight gain, diminished abdominal fat, and increased nonalcoholic steatohepatitis activities under the AHF diet. Gene-expression analysis and chromatin-immunoprecipitation assay indicated that CREBH is required to activate the expression of the genes encoding functions involved in de novo lipogenesis, TG and cholesterol biosynthesis, FA elongation and oxidation, lipolysis, and lipid transport. Supporting the role of CREBH in lipogenesis and lipolysis, forced expression of an activated form of CREBH protein in the liver significantly increases accumulation of hepatic lipids, but reduces plasma TG levels in mice.

Conclusion: All together, our study shows that CREBH plays a key role in maintaining lipid homeostasis by regulating the expression of the genes involved in hepatic lipogenesis, FA oxidation, and lipolysis under metabolic stress. The identification of CREBH as a stress-inducible metabolic regulator has important implications in the understanding and treatment of metabolic disease.


Figures

Figure 1
Figure 1. Metabolic stress signals can activate CREBH
(A) HuH-7 cells were transfected with plasmid DNA vector expressing full-length human CREBH protein fused with N-terminal 3 copies of Flag tag. At 48 hours after the transfection, the cells were treated with PBS (control), tunicamycin (TM, 5μg/ml), insulin (100nM), or PA (10μM) for 6 hours. The non-transfected cells were included as negative controls. Western blot analysis was performed to detect CREBH cleavage by using an anti-flag antibody. CREBH (f), full-length CREBH; CREBH (a), activated/cleaved CREBH. Levels of GAPDH were determined for protein loading controls. (B-C) Primary hepatocytes isolated from wild-type mice were treated with insulin (100nM) for 10, 30, 40, 60, and 360 min or PA (10μM) for 0.5, 1, 2, 4 and 8 hours. Western blot analysis was performed to detect endogenous CREBH cleavage using a polyclonal anti-CREBH antibody. (D) Western blot analysis of CREBH cleavage in the liver tissue samples from wild-type mice under the normal chow (NC) or AHF diet for 6 months. For A-D, The values below the gels represent the activated form of CREBH protein signal intensities after normalization to full-length CREBH signal intensities. (E) Quantitative real-time RT-PCR analysis of expression of the CrebH mRNA in mouse primary hepatocytes treated with TM (5μg/ml), PA (10μM), or insulin (100nM) for 6 hours. Expression values were normalized to β-actin mRNA levels. Fold changes of mRNA are shown by comparing to that of non-treated control hepatocytes. Each bar denotes the mean ± SD (n=3 samples per treatment). (F) Quantitative real-time RT-PCR analysis of expression of the CrebH mRNA in the liver of age-matched male mice under normal chow diet, after 16 hours of fasting, or on the AHF diet for 6 months. Expression values were normalized to β-actin mRNA levels. Fold changes of mRNA levels are shown by comparing to one of the mice under normal chow diet. Each bar denotes the mean ± SEM (n=6 mice per group).
Figure 2
Figure 2. The CrebH null mice show a reduction in whole body fat mass, hepatic TG, and plasma cholesterol but an increase in plasma TG
(A) Body weights of the CrebH null and wild-type control mice of 5-months old on normal chow diet. Each bar denotes the mean ± SEM (n=6 mice per group). (B) Whole body fat mass of CrebH null and wild-type control mice of 5-months old on normal chow diet. Each bar denotes the mean ± SEM (n=6 mice per group). * P<0.05. (C) Daily food intakes of the CrebH null and wild-type mice of 5-months old under the normal chow diet. The daily food intake was determined based on the measurement of food consumption of the CrebH null and control mice in one week. Each bar denotes the mean ± SEM (n=8 wild-type mice or 7 knockout mice). (D) Levels of hepatic and plasma TG in the CrebH null and wild-type mice of 5-months old under the normal chow diet. Each bar denotes the mean ± SEM (n=6 mice per group). * P<0.05. (E) Levels of plasma total cholesterol, HDL, and LDL in the CrebH null and wild-type control mice of 5-months old under the normal chow diet. Each bar denotes the mean ± SEM (n=6 mice per group). * P<0.05; ** P<0.01. (F) Levels of plasma TG and 3-hydroxybutyric acid (BOH) in the CrebH null and wild-type mice after 16 hours of fasting. Each bar denotes the mean ± SEM (n=6 mice per group). ** P<0.01.
Figure 3
Figure 3. CrebH null mice display reduced body weight gain, massive steatosis, diminished abdominal fat, and hypertriglyceridemia under the AHF diet
(A) Photograph of representative CrebH null and wild-type control mice after the AHF diet for 6 months (left), and the body weights of the CrebH null and wild-type control mice under normal chow diet or after the AHF diet (right). Each bar denotes the mean ± SEM (n=6 mice per group). ** P<0.01. (B) Liver and abdominal fat tissue of the wild-type control and CrebH null mice were visualized in situ (left), and liver mass of the wild-type and CrebH null mice after 6 months on the AHF diet (right). Each bar denotes the mean ± SEM (n=6). ** P<0.01. (C) Photograph of blood plasma samples from representative CrebH null and wild-type mice at 6 months after the AHF diet. (D) Oil-red O staining of cytosolic lipids in the liver tissue sections of representative CrebH null and wild-type control mice after the AHF diet for 6 months (magnification: 600x). (E-F) Levels of plasma TG, total cholesterol, HDL, and LDL, and levels of hepatic TG in the CrebH null and wild-type control mice after the AHF diet for 6 months. Each bar denotes the mean ± SEM (n=6). ** P<0.01.
Figure 4
Figure 4. Deletion of CrebH leads to impaired FA metabolism and profound NASH in the mice under the AHF diet
(A) Lipidomic analysis of eicosanoids and docosanoids in the liver tissues of the CrebH null and wild-type control mice after the AHF diet for 6 months. Levels of lipid metabolites that were decreased or increased in the CrebH null liver, compared to that in the wild-type control liver (P-value cutoff was <0.05), were shown. Each bar denotes the mean ± SEM (n=4 mice per group). (B) Histological examination (hematoxylin eosion staining) of liver tissue sections of the CrebH null and wild-type mice after the AHF diet for 6 months (magnification: 200x). (C) Sirius staining of collagen deposition in the liver tissue of the wild-type and CrebH null mice after the AHF diet (magnification: 200x). (D) Histological scoring for NASH activities in the livers of the CrebH null and wild-type mice after the AHF diet for 6 months. The Grade scores were calculated based on the scores of steatosis, hepatocyte ballooning, lobular and portal inflammation, and Mallory bodies. The Stage scores were based on the liver fibrosis. Mean ± SEM (n=4) values are shown. P-values were calculated by Mann-Whitney U-test.
Figure 5
Figure 5. Deletion of CrebH leads to defective expression of genes involved in lipogenesis, FA and cholesterol metabolism, and lipolysis
Total RNAs were isolated from liver tissues of the CrebH null and wild-type control mice under the normal chow diet or after the AHF diet for 6 months, and subjected to quantitative real-time RT-PCR analysis of expression of the genes involved in hepatic lipid metabolism. Expression values were normalized to β-actin mRNA levels. Fold changes of mRNA levels are shown by comparing to one of the control mouse under the normal chow diet or the AHF diet. Each bar denotes the mean ± SEM (n=4). * P<0.05; ** P<0.01.
Figure 6
Figure 6. CREBH binds to and activate expression of the genes involved in hepatic lipid metabolism
(A-B) ChIP analysis of CREBH-binding activity to the promoter regions of the genes involved in hepatic lipid metabolism. Primary hepatocytes isolated from the CrebH null liver were infected with adenovirus expressing GFP or an activated CREBH protein with N-terminal fused flag tag. PCR was performed to identify potential CREBH-binding regions in the genes whose expression was defective in the CrebH null liver. Mock ChIP was included as a negative control (N-ctl). The PCR reactions with the genomic DNA isolated from sonicated cell lysates were included as positive controls (P-ctl). (C-E) Gene expression analysis in the liver of the mice over-expressing the activated CREBH. Total RNAs from the mice infected with adenovirus expressing GFP or the activated CREBH for 72 hours were subjected to quantitative real-time RT-PCR analysis of gene expression. Expression values were normalized to β-actin mRNA levels. Fold changes of mRNA levels are shown by comparing to one of the mice over-expressing GFP. Each bar denotes the mean ± SEM (n=3). ** P<0.01. (F) Western blot analysis of protein levels for CREBH in the nuclear extract (NE), SCD1 and PGC1 in the liver tissue lysates, and ApoA4 in the blood plasma of mice over-expressing GFP or the activated CREBH. Levels of GAPDH and Albumin were included as loading controls for liver tissue lysate and blood plasma samples, respectively.
Figure 7
Figure 7. CREBH is required for lipogenesis and lipolysis
(A) Oil-red O staining of cytosolic lipids in the CrebH null and wild-type control primary hepatocytes after the treatment of vehicle, TM (5μg/ml), or PA (100μM) for 12 hours (magnification: 400x). (B) Fat tolerance test for the CrebH null and wild-type control mice. Mice were fasted for 16 hours, followed by oral gavage of pure olive oil at the dose of 12 μl/g body weight. Plasma TG levels were determined immediately before and at 2, 4, 6, and 8 hours after olive oil loading. The mean ± SEM (n=5) values were shown.
Figure 8
Figure 8. Forced expression of the activated CREBH in the liver increases lipogenesis and lipolysis
(A) Oil-red O staining of cytosolic lipids in the liver tissue sections of the mice over-expressing GFP or the activated form of CREBH (magnification: 400 ×). Frozen liver tissue sections were prepared from the mice at 72 hours after the infection with adenovirus expressing GFP or the activated CREBH through tail vein injection. (B-C) Levels of hepatic TG and plasma TG in the liver of the mice over-expressing GFP or the activated CREBH. Each bar denotes the mean ± SEM (n=3). ** P<0.01. (D) A working model for the role of CREBH in regulating lipid homeostasis under metabolic stress

References

    1. Musso G, Gambino R, Cassader M. Recent insights into hepatic lipid metabolism in non-alcoholic fatty liver disease (NAFLD). Prog Lipid Res. 2009;48:1–26. - PubMed
    1. Jump DB, Botolin D, Wang Y, Xu J, Christian B, Demeure O. Fatty acid regulation of hepatic gene transcription. J Nutr. 2005;135:2503–2506. - PubMed
    1. Postic C, Girard J. Contribution of de novo fatty acid synthesis to hepatic steatosis and insulin resistance: lessons from genetically engineered mice. J Clin Invest. 2008;118:829–838. - PMC - PubMed
    1. Brown MS, Goldstein JL. The SREBP pathway: regulation of cholesterol metabolism by proteolysis of a membrane-bound transcription factor. Cell. 1997;89:331–340. - PubMed
    1. Rutkowski DT, Wu J, Back SH, Callaghan MU, Ferris SP, Iqbal J, Clark R, et al. UPR pathways combine to prevent hepatic steatosis caused by ER stress-mediated suppression of transcriptional master regulators. Dev Cell. 2008;15:829–840. - PMC - PubMed

Publication types

MeSH terms