

X-ray emission spectroscopy evidences a central carbon in the nitrogenase iron-molybdenum cofactor
- PMID: 22096198
- PMCID: PMC3800678
- DOI: 10.1126/science.1206445
X-ray emission spectroscopy evidences a central carbon in the nitrogenase iron-molybdenum cofactor
Abstract
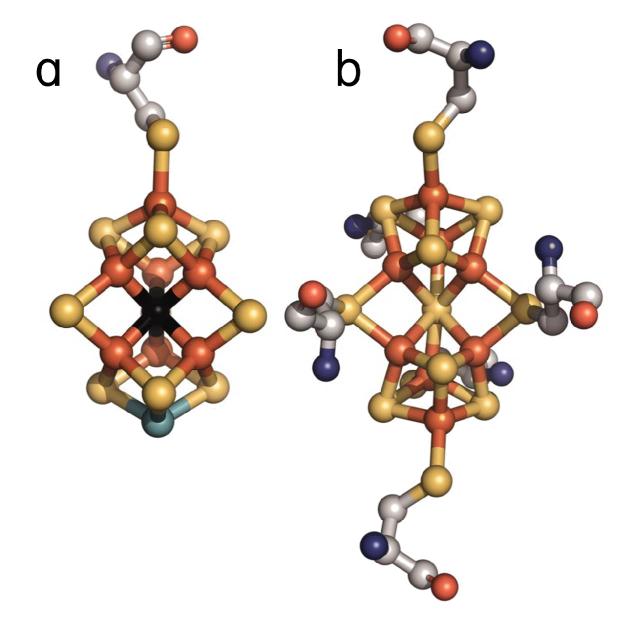
Nitrogenase is a complex enzyme that catalyzes the reduction of dinitrogen to ammonia. Despite insight from structural and biochemical studies, its structure and mechanism await full characterization. An iron-molybdenum cofactor (FeMoco) is thought to be the site of dinitrogen reduction, but the identity of a central atom in this cofactor remains unknown. Fe Kβ x-ray emission spectroscopy (XES) of intact nitrogenase MoFe protein, isolated FeMoco, and the FeMoco-deficient nifB protein indicates that among the candidate atoms oxygen, nitrogen, and carbon, it is carbon that best fits the XES data. The experimental XES is supported by computational efforts, which show that oxidation and spin states do not affect the assignment of the central atom to C(4-). Identification of the central atom will drive further studies on its role in catalysis.
Figures


Comment in
-
Biochemistry. One atom makes all the difference.Science. 2011 Nov 18;334(6058):914-5. doi: 10.1126/science.1215283. Science. 2011. PMID: 22096179 No abstract available.
References
-
- Einsle O, et al. Nitrogenase MoFe protein at 1.16 Å resolution. Science. 2002;297:1696. - PubMed
-
- Lukoyanov D, et al. Testing if the interstitial atom, X, of the nitrogenase molybdenum-iron cofactor is N or C: ENDOR, ESEEM, and DFT studies of the S=3/2 resting state in multiple environments. Inorg. Chem. 2007;46:11437. - PubMed
Publication types
MeSH terms
Substances
Grants and funding
LinkOut - more resources
Full Text Sources
Other Literature Sources
Miscellaneous
