. 2012 Jan 5;119(1):83-94.
doi: 10.1182/blood-2011-02-335430. Epub 2011 Nov 16.

Integrin-αvβ3 regulates thrombopoietin-mediated maintenance of hematopoietic stem cells

Affiliations

Integrin-αvβ3 regulates thrombopoietin-mediated maintenance of hematopoietic stem cells

Terumasa Umemoto et al. Blood. .

Abstract

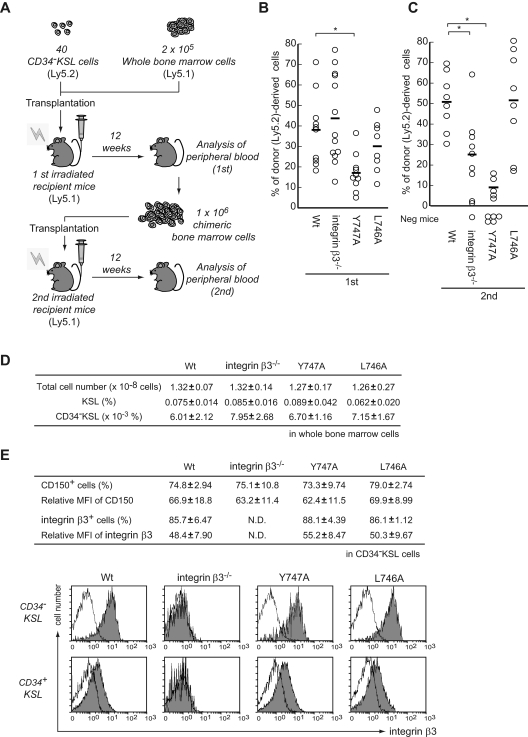
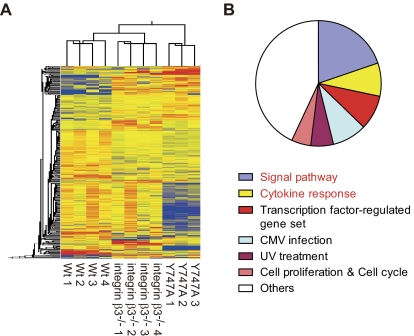
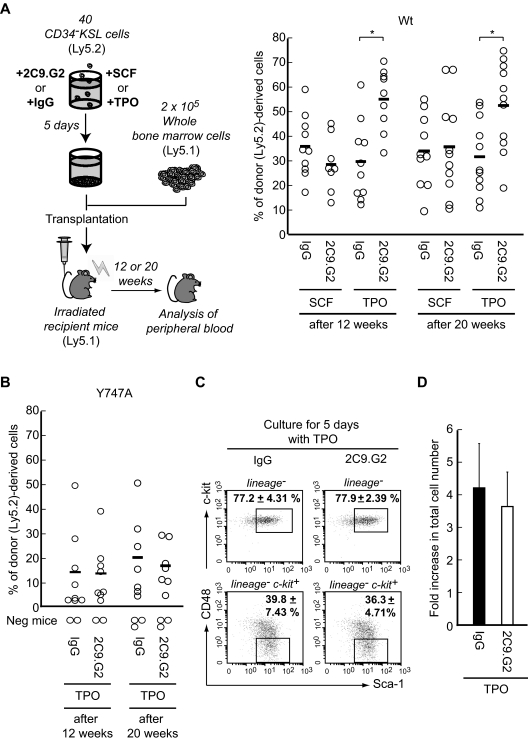
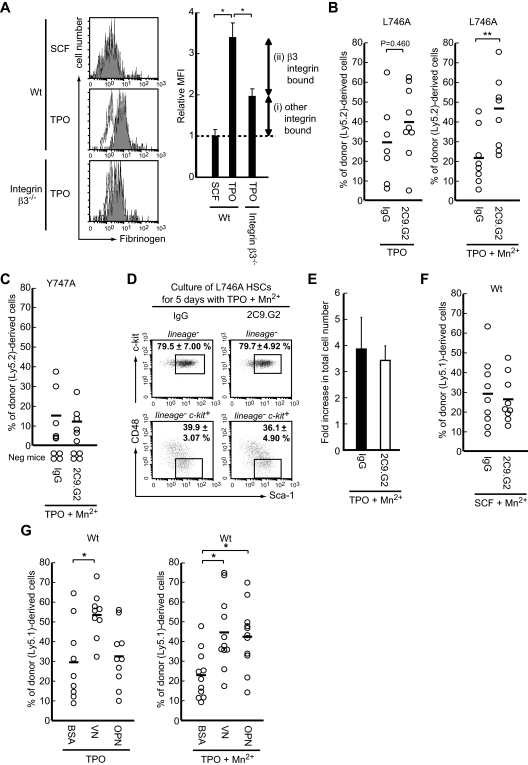
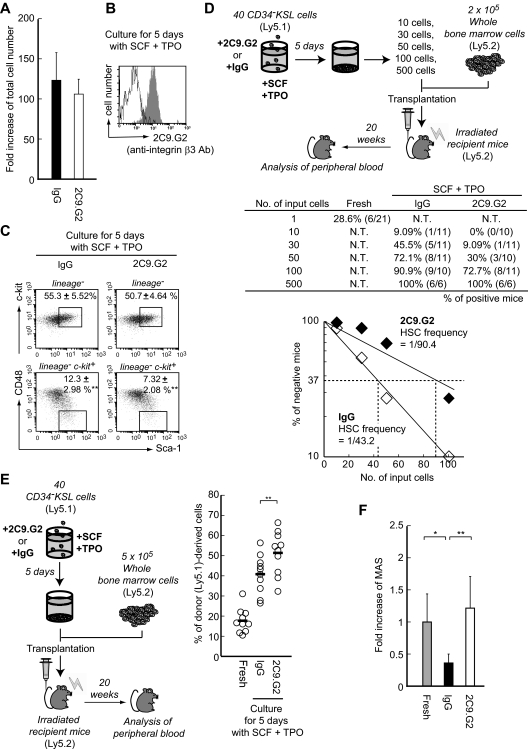
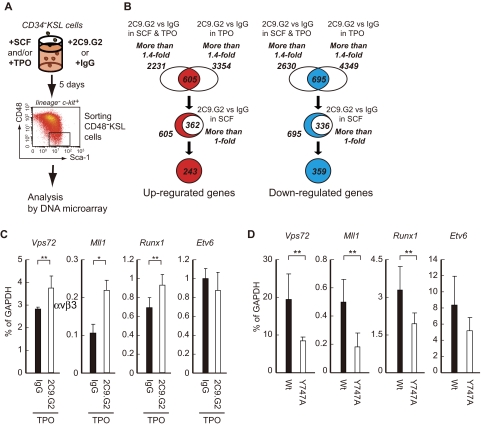
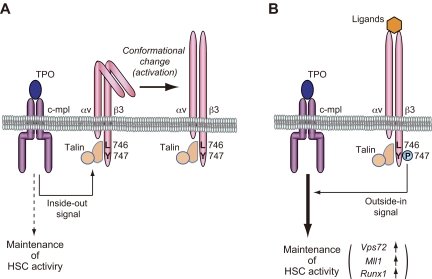
Throughout life, one's blood supply depends on sustained division of hematopoietic stem cells (HSCs) for self-renewal and differentiation. Within the bone marrow microenvironment, an adhesion-dependent or -independent niche system regulates HSC function. Here we show that a novel adhesion-dependent mechanism via integrin-β3 signaling contributes to HSC maintenance. Specific ligation of β3-integrin on HSCs using an antibody or extracellular matrix protein prevented loss of long-term repopulating (LTR) activity during ex vivo culture. The actions required activation of αvβ3-integrin "inside-out" signaling, which is dependent on thrombopoietin (TPO), an essential cytokine for activation of dormant HSCs. Subsequent "outside-in" signaling via phosphorylation of Tyr747 in the β3-subunit cytoplasmic domain was indispensable for TPO-dependent, but not stem cell factor-dependent, LTR activity in HSCs in vivo. This was accompanied with enhanced expression of Vps72, Mll1, and Runx1, 3 factors known to be critical for maintaining HSC activity. Thus, our findings demonstrate a mechanistic link between β3-integrin and TPO in HSCs, which may contribute to maintenance of LTR activity in vivo as well as during ex vivo culture.


Figures

Figure 1
Figure 1
Tyr747 of β3-integrin is essential for the long-term in vivo repopulating and self-renewal activities of mouse HSCs, independent of ex vivo expansion. (A) HSCs from WT or mutant mice were used for serial competitive repopulation assays. Forty sorted CD34KSL cells (Ly5.2) were transplanted into lethally irradiated mice (Ly5.1) along with 2 × 10⁵ BM competitor cells (Ly5.1). Twelve weeks later, the percentage of donor cells (Ly5.2) was determined in peripheral blood (B). A total of 106 BM cells from primary recipient mice were then transplanted into other irradiated mice, followed by secondary analysis of peripheral blood (C). The plot indicates donor-derived cells (percentage of Ly5.2+ cells) in the peripheral blood. In addition, recipient mice with donor cell chimerism of < 1.0% for any lineage were considered not to be reconstituted (negative mice). Bars represent mean values. *P < .01. (D) The table shows the total cell number and frequency of HSC subsets among BMCs from both femurs and tibias. (E) Also shown are the frequencies or relative mean fluorescent intensity (MFI) in CD150+ and integrin-β3+ cells among the CD34KSL population. The value of the MFI obtained in the presence of the isotype control IgG was used as the control. Data are mean ± SD (n = 6-8). The histograms represent the expression of β3-integrin in murine HSCs (CD34KSL) or hematopoietic progenitors (CD34+KSL) derived from WT, integrin-β3−/−, and Y747A or L746A mutants, all of which are shown in white. The isotype control is in gray.
Figure 2
Figure 2
The gene expression profile in Y747A-mutant HSCs differed from that in WT and integrin-β3−/− HSCs. (A) After whole transcriptome analysis of WT, integrin-β3−/− and Y747A HSCs using SOLiD sequencing, hierarchical cluster analysis was performed after filtration based on ANOVA (P < .05) and a > 2-fold change against WT (at least one pair). Up-regulated and down-regulated genes are shown in red and blue, respectively. (B) GSEA was performed using the whole transcriptome of WT and Y747A HSCs. The pie chart represents the distribution of 102 gene sets up-regulated in WT HSCs, compared with Y747A HSCs, into the indicated categories. The threshold was set at P < .05 and FDR (q < 0.25).
Figure 3
Figure 3
β3-Integrin-mediated maintenance of long-term HSC repopulating activity during ex vivo expansion is dependent on TPO, but not SCF. (A) To assess the influence of β3-integrin signaling, 40 CD34KSL cells (Ly5.2) derived from WT (A) or Y747A mice (B) were cultured for 5 days in the presence of 2C9.G2 or IgG in serum-free medium supplemented with 50 ng/mL SCF or 50 ng/mL TPO. After the culture, whole cultured cells were transplanted with 2 × 10⁵ BM competitor cells (Ly5.1) into lethally irradiated Ly5.1 mice. The plots depict the percentage of donor (Ly5.2)–derived cells in the peripheral blood of individual mice 12 weeks or 20 weeks after transplantation. Bars represent mean values. *P < .01. Recipient mice with donor cell chimerism of less than 1.0% for any lineage were considered not to be reconstituted (negative mice). (C) After culture of 1000 sorted WT CD34KSL cells (Ly5.1) for 5 days with 2C9.G2 or hamster IgG (isotype control) in the presence of TPO, the percentages of KSL and CD48KSL cells were determined by flow cytometric analysis. The values in the dot plots are mean ± SD. (D) After culture, the total cell number was counted. The graph shows the fold increase in total cell number after 5 days of culture. Data are mean ± SD.
Figure 4
Figure 4
TPO changes the activation status of β3-integrin through inside-out signaling, and post-ligation outside-in signaling via β3PY747 is indispensable for maintenance of HSC function during ex vivo expansion. (A) CD34KSL cells derived from WT and β3−/− mice were cultured with AlexaFlour 647–labeled fibrinogen in S-Clone SF-03 medium, with or without SCF or TPO. The fluorescence intensity of the bound fibrinogen was analyzed by flow cytometry: white represents no cytokine; and gray, stimulation of cytokine. The graphs represent the relative mean fluorescence intensity (MFI); binding in the absence of cytokine served as the control. Data are mean ± SD; n > 3. *P < .01. (B-C) Forty CD34KSL cells obtained from BM of L746A (Ly5.2; B) or Y747A mice (Ly5.2; C) were cultured with TPO for 5 days in the presence of 2C9.G2 or IgG and examined using transplantation assays, as described in Figure 2. To exogenously induce integrin activation (change the structure to the activated state), Mn2+ was added to TPO-containing medium. (D) After culture of 1000 sorted L746A-mutant CD34KSL cells (Ly5.1) for 5 days with 2C9.G2 or hamster IgG (isotype control) in the presence of TPO and Mn2+, the percentages of KSL and CD48KSL cells were determined by flow cytometry. The values in the dot plots are mean ± SD. (E) After the culture, the total cell number was counted. The graph represents the fold increase in total cell number after 5 days of culture. Data are mean ± SD. (F) Forty WT CD34KSL cells (Ly5.1) were also cultured for 5 days in medium containing SCF and Mn2+ along with 2C9.G2 or IgG. (G) Using plates coated with VN, OPN, or BSA, 40 WT CD34KSL cells (Ly5.1) were cultured with TPO for 5 days in the absence or presence of Mn2+. After the culture, cells were transplanted along with 2 × 10⁵ BM competitor cells into irradiated recipient mice. The plots represent the percentage of donor (Ly5.2 or Ly5.1)-derived cells in the peripheral blood of individual mice 12 weeks after transplantation. *P < .01. **P < .05. Recipient mice with donor cell chimerism of < 1.0% for any lineage were considered not to be reconstituted (negative mice).
Figure 5
Figure 5
Integrin-β3–mediated signaling leads to the suppression of expansion and cell division on HSCs during ex vivo culture. Forty sorted WT CD34KSL cells (Ly5.1) were cultured for 5 days with 2C9.G2 or hamster IgG (isotype control) in S-Clone SF-03 serum-free medium supplemented with 50 ng/mL SCF plus 50 ng/mL TPO. (A) After the culture, total cell number was counted. Graph represents fold increase of total cell number after 5 days of culture. Data are mean ± SD. (B) To confirm 2C9.G2 binding to cells during culture, cells were stained with fluorescently labeled hamster IgG and analyzed by flow cytometry: white represents IgG; and gray, 2C9.G2. (C) The percentages of KSL and CD48KSL cells were also determined by flow cytometry after culture. **P < .05. (D) HSC frequency among the cultured cells was determined using limiting dilution assays. After groups of 10, 30, 50, 100, or 500 whole cultured cells were counted exactly and sorted, the groups were individually transplanted into lethally irradiated Ly5.2 mice along with 2 × 10⁵ BM cells from Ly5.2 mice. This was followed by analysis for chimerism 20 weeks after the transplantation. The table shows the rate of positive mice (multilineage reconstituted mice); the numbers in parentheses are the positive mice/tested mice. In the case of fresh CD34KSL cells, a single cell was transplanted. After determining the percentage of reconstructed mice (table), the percentage of unreconstructed mice (percentage of negative mice on y-axis) was plotted versus the number of input cells, leading to a theoretical HSC frequency based on a Poisson distribution. Inputting 500 cells resulted in 0% negative mice, and these data are not plotted. (E) Fresh or whole cultured cells (Ly5.1) were transplanted into lethally irradiated mice (Ly5.2) along with 5 × 10⁵ BM cells (Ly5.2). Twenty weeks later, peripheral blood from the recipient mice was analyzed by flow cytometry. The plots represent the percentage of donor-derived cells (percentage of Ly5.1+ cells) in the peripheral blood of individual recipients. Bars represent the mean values. **P < .05. (F) In addition, the MAS reflects the repopulating ability of single HSCs, as estimated from the RU value (supplemental Table 2) and HSC number (supplemental Table 2). Data are mean ± SD. *P < .01. **P < .05.
Figure 6
Figure 6
Integrin-β3–mediated signaling enhanced expression of stemness-related genes by cooperating TPO presence. (A) DNA array analysis was performed using CD48KSL cells after culture. The cells were sorted after culturing CD34KSL cells for 5 days with 2C9.G2 or IgG in the presence of SCF and/or TPO. (B) Genes whose expression had changed from the DNA microarray data and genes that showed > 1.4-fold up-regulation (with TPO: 2231 genes or SCF + TPO: 3354 genes) or down-regulation (with TPO: 4349 genes or SCF + TPO: 2630 genes) in 2C9.G2-treated cells were selected for extraction. This was followed by extraction of genes included in both populations (up-regulation, 605 genes; down-regulation, 695 genes). In addition, to clearly focus on the effect of the combination by TPO and β3-integrin signaling, genes only showing > 1.0-fold up-regulation (362 genes) or down-regulation (336 genes) in the presence of SCF were excluded. This left 243 genes that were up-regulated and 359 that were down-regulated in HSCs by 2C9.G2 in the presence of TPO. (C) Expression of candidate genes involved in the maintenance of LTR activity of HSCs was assessed using real-time RT-PCR with 2C9.G2- or IgG-treated CD34KSL cells cultured in the presence of TPO. The graphs represent mRNA expression of the indicated genes. Data are mean ± SD; n > 3. **P < .05. (D) Fresh (uncultured) CD34KSL cells obtained from the BM of WT or Y747A mice were also subjected to real-time RT-PCR to examine expression of these genes. The graphs represent mRNA expression of the indicated genes. Data are mean ± SD; n > 3. **P < .05.
Figure 7
Figure 7
Model depicting the role of β3-integrin in TPO-dependent regulation of HSC division leading to the maintenance of LTR ability. Integrin-β3 bidirectional signaling and TPO were dependent on each other in the maintenance of HSCs. (A) TPO/c-mpl signaling leads to conformational change of integrin-αvβ3 into high-affinity form for their ligands (the activation of integrin-αvβ3) by inducing inside-out signaling. (B) Outside-in signaling via Tyr747 phosphorylation of integrin-β3 induces enhanced expression of stemness-related genes after their ligation.

Similar articles

Cited by

References

    1. Arai F, Hirao A, Ohmura M, et al. Tie2/angiopoietin-1 signaling regulates hematopoietic stem cell quiescence in the bone marrow niche. Cell. 2004;118(2):149–161. - PubMed
    1. Nilsson SK, Johnston HM, Whitty GA, et al. Osteopontin, a key component of the hematopoietic stem cell niche and regulator of primitive hematopoietic progenitor cells. Blood. 2005;106(4):1232–1239. - PubMed
    1. Qian H, Buza-Vidas N, Hyland CD, et al. Critical role of thrombopoietin in maintaining adult quiescent hematopoietic stem cells. Cell Stem Cell. 2007;1(6):671–684. - PubMed
    1. Yoshihara H, Arai F, Hosokawa K, et al. Thrombopoietin/MPL signaling regulates hematopoietic stem cell quiescence and interaction with the osteoblastic niche. Cell Stem Cell. 2007;1(6):685–697. - PubMed
    1. Yamazaki S, Iwama A, Takayanagi S, Eto K, Ema H, Nakauchi H. TGF-beta as a candidate bone marrow niche signal to induce hematopoietic stem cell hibernation. Blood. 2009;113(6):1250–1256. - PubMed

Publication types

MeSH terms