. 2011;6(11):e27121.
doi: 10.1371/journal.pone.0027121. Epub 2011 Nov 11.

Whole-genome comparison of two Campylobacter jejuni isolates of the same sequence type reveals multiple loci of different ancestral lineage

Affiliations

Whole-genome comparison of two Campylobacter jejuni isolates of the same sequence type reveals multiple loci of different ancestral lineage

Patrick J Biggs et al. PLoS One. 2011.

Abstract

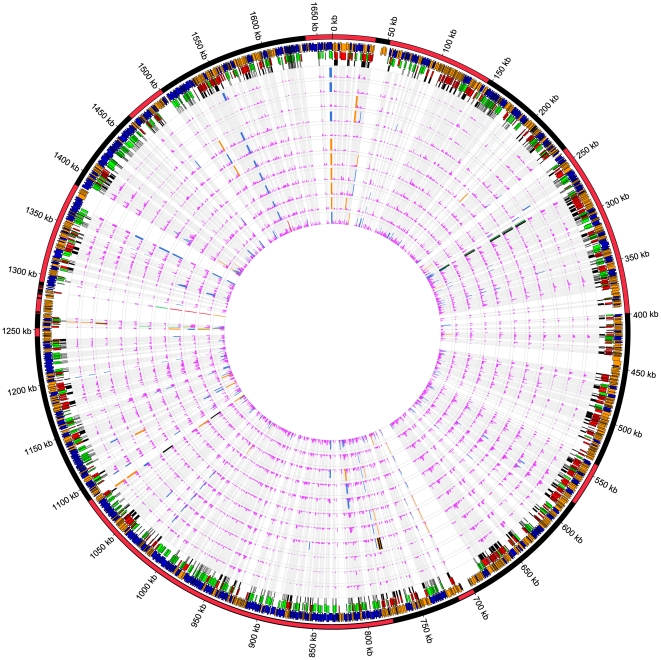
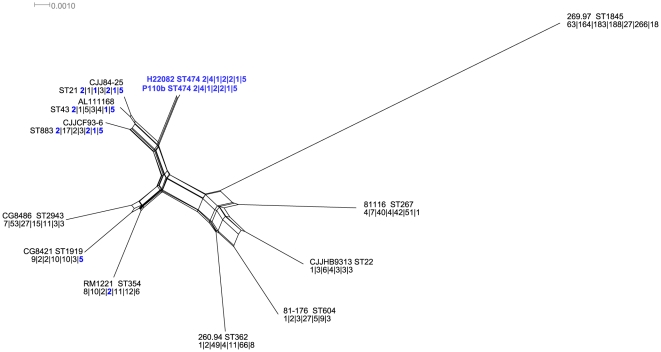
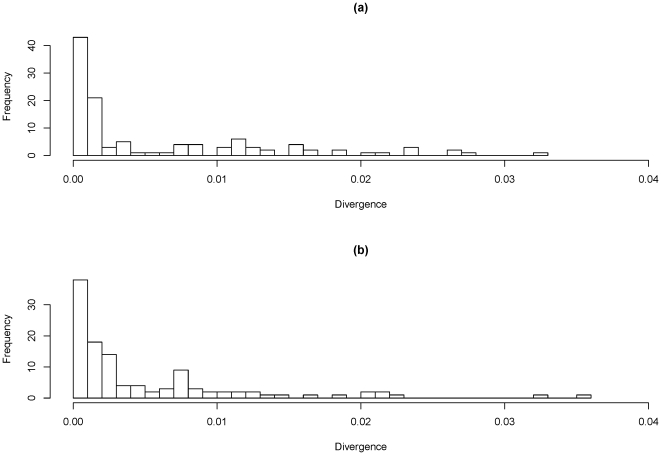
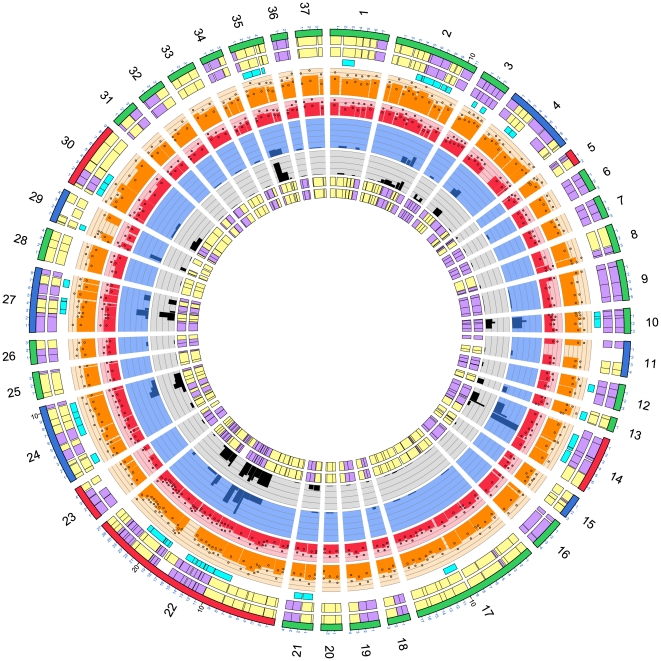
Campylobacter jejuni ST-474 is the most important human enteric pathogen in New Zealand, and yet this genotype is rarely found elsewhere in the world. Insight into the evolution of this organism was gained by a whole genome comparison of two ST-474, flaA SVR-14 isolates and other available C. jejuni isolates and genomes. The two isolates were collected from different sources, human (H22082) and retail poultry (P110b), at the same time and from the same geographical location. Solexa sequencing of each isolate resulted in ~1.659 Mb (H22082) and ~1.656 Mb (P110b) of assembled sequences within 28 (H22082) and 29 (P110b) contigs. We analysed 1502 genes for which we had sequences within both ST-474 isolates and within at least one of 11 C. jejuni reference genomes. Although 94.5% of genes were identical between the two ST-474 isolates, we identified 83 genes that differed by at least one nucleotide, including 55 genes with non-synonymous substitutions. These covered 101 kb and contained 672 point differences. We inferred that 22 (3.3%) of these differences were due to mutation and 650 (96.7%) were imported via recombination. Our analysis estimated 38 recombinant breakpoints within these 83 genes, which correspond to recombination events affecting at least 19 loci regions and gives a tract length estimate of ~2 kb. This includes a ~12 kb region displaying non-homologous recombination in one of the ST-474 genomes, with the insertion of two genes, including ykgC, a putative oxidoreductase, and a conserved hypothetical protein of unknown function. Furthermore, our analysis indicates that the source of this recombined DNA is more likely to have come from C. jejuni strains that are more closely related to ST-474. This suggests that the rates of recombination and mutation are similar in order of magnitude, but that recombination has been much more important for generating divergence between the two ST-474 isolates.


Conflict of interest statement

Competing Interests: The authors have declared that no competing interests exist.

Figures

Figure 1
Figure 1. Circos plot showing the sequence differences detectable at the protein level for C. jejuni strain H22082.
The figure shows the location of the core genome genes as located within the H22082 draft genome when compared to the core genomes of 11 C. jejuni reference strains. The tracks from outside to inside are; chromosomal ideogram (alternating colours indicate contigs), Glimmer gene prediction on the whole genome (forward genes in orange, and reverse genes in blue); core genome genes (forward genes in red, and reverse genes in green); core genome genes that are the same length (forward genes in black, and reverse genes in grey); 11 histograms showing the number of sequence differences detectable as a fraction of protein length against the genomes in the following order: CJJ84-25, AL111168, CJJCF93-6, CG8421, CG8486, RM1221, CJJHB9313, 81-176, 81116, 260.94 and 269.97. For clarity, the histograms have been scaled to cover the range 0 to 0.10 (purple 0 to 0.05 and blue 0.05 to 0.10). The values above 0.10 are plotted as a full scale value with colours indicating the scale: orange (0.10 to 0.20), black (0.20 to 0.30), green (0.30 to 0.40) and red (above 0.40).
Figure 2
Figure 2. The unrooted NeighborNet network of the two ST-474 strains and the 11 referenceC. jejuni strains.
The two ST-474 strains (P110b and H22082) are shown in bold blue text. The network is at the DNA level (430641 bases), using 477 of the 1001 genes that have orthologous gene members of the same length. For each genome, the name as well as the sequence type (ST) and allele profile is shown. The alleles the reference genomes share with those in ST-474 are indicated in blue bold text.
Figure 3
Figure 3. Plot of frequency of mutational differences per gene.
(a) Differences are shown for the two ST-474 isolates and, (b) of H22082 against the reference genome. Divergence shown for the genes at which the two ST-474 differed. For the latter comparison, each gene was compared with the reference genome whose gene sequence was the most similar.
Figure 4
Figure 4. Circos plot of orthologous genomic regions for the two ST-474 genomes where sequence differences are found.
The figure shows 37 detectable regions. Orthologous gene pairs in P110b and H22082 were calculated using OrthoMCL with a ‘pi_cutoff’ value of 0.95. The tracks from outside to inside are; genome region name and size (green, regions of same length in P110b and H22082; blue, the region from P110b is longer; red, the region from H22082 is longer); genes and sizes for P110b; genes and sizes for H22082; genes coloured cyan showing evidence of recombination; histograms for P110b (orange) and H22082 (red) showing the nucleotide coverage from the short reads plotted as an average over the length of the gene, along with the standard deviations for the coverage as round circles; histograms showing the number of sequence differences between the genes at the protein level (dark blue on a light blue background) and DNA level (black on a grey background) as a fraction of protein or gene length respectively; a repeat of the gene sizes and locations in P110b and H22082. Gene orientations are shown in purple and yellow for the forward and reverse strand respectively. The nucleotide coverage histograms have the same scale but a different magnitude, 180 and 120 for P110b and H22082 respectively. Similarly the sequence difference histograms have the same scale but a different magnitude, 0.05 and 0.04 for the protein and the DNA histograms respectively.

References

    1. Metzker ML. Sequencing technologies - the next generation. Nat Rev Genet. 2010;11:31–46. - PubMed
    1. Didelot X, Falush D. Inference of bacterial microevolution using multilocus sequence data. Genetics. 2007;175:1251–1266. - PMC - PubMed
    1. Falush D. Toward the use of genomics to study microevolutionary change in bacteria. PLoS Genet. 2009;5:e1000627. - PMC - PubMed
    1. Kingsford C, Schatz MC, Pop M. Assembly complexity of prokaryotic genomes using short reads. BMC Bioinformatics. 2010;11:21. - PMC - PubMed
    1. Humphrey T, O'Brien S, Madsen M. Campylobacters as zoonotic pathogens: a food production perspective. Int J Food Microbiol. 2007;117:237–257. - PubMed

Publication types

MeSH terms

LinkOut - more resources