. 2011;6(11):e27384.
doi: 10.1371/journal.pone.0027384. Epub 2011 Nov 11.

IRF8 governs expression of genes involved in innate and adaptive immunity in human and mouse germinal center B cells

Affiliations

IRF8 governs expression of genes involved in innate and adaptive immunity in human and mouse germinal center B cells

Dong-Mi Shin et al. PLoS One. 2011.

Abstract

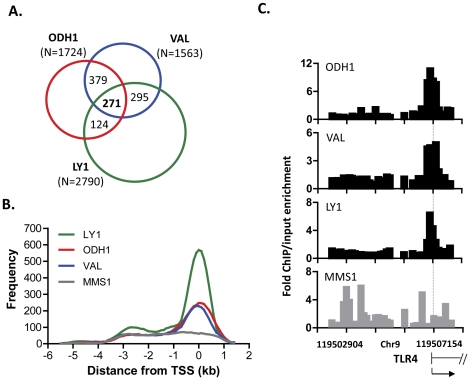
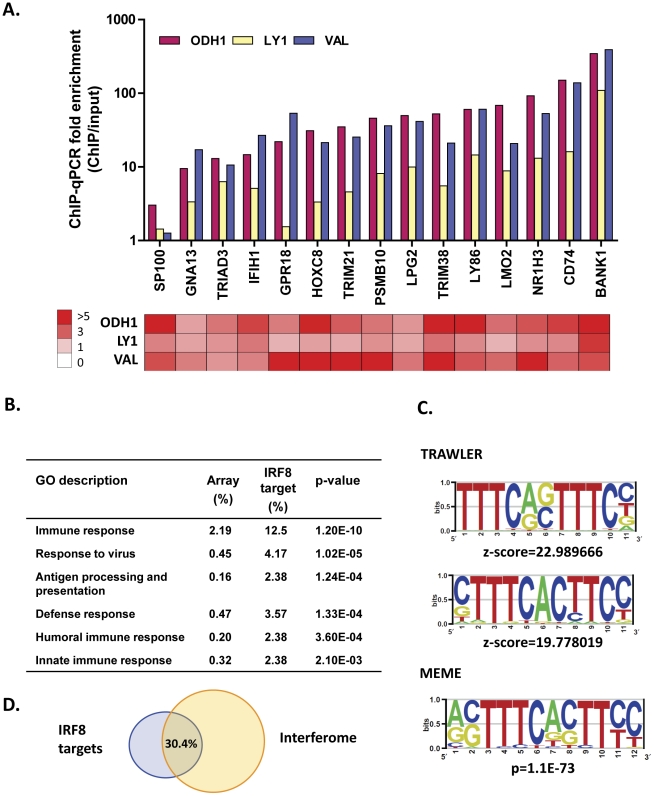
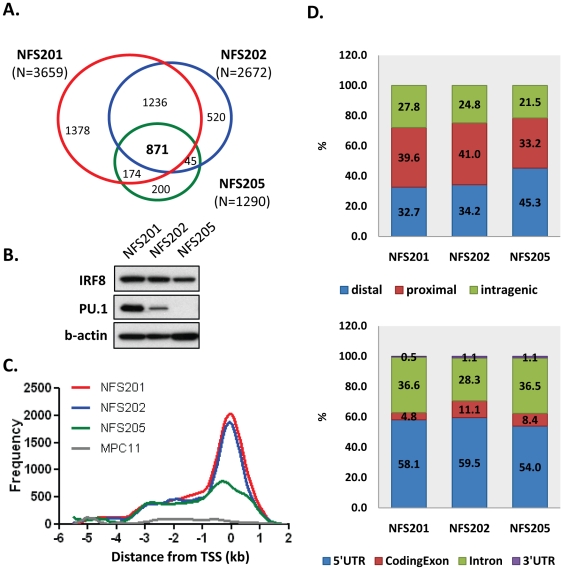
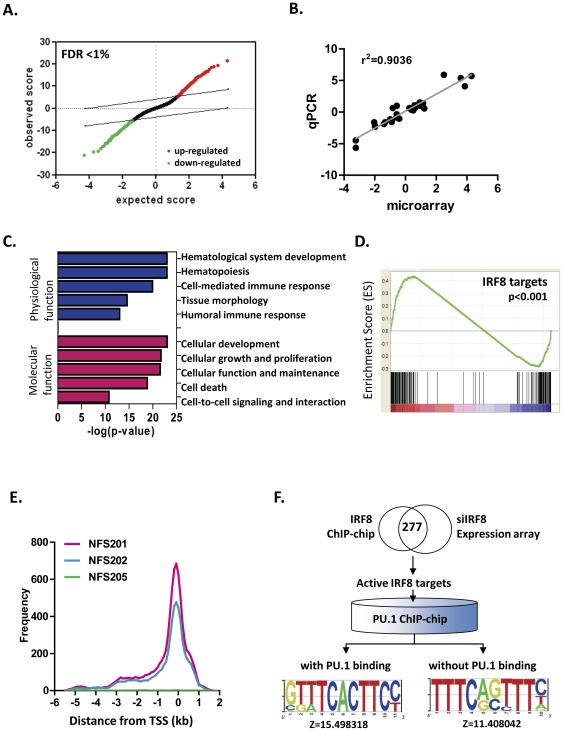
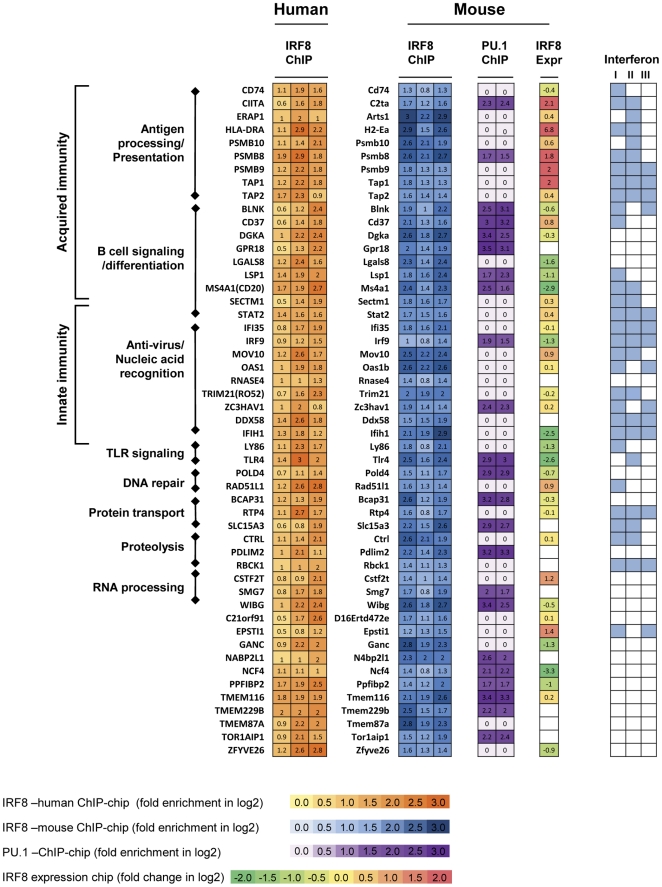
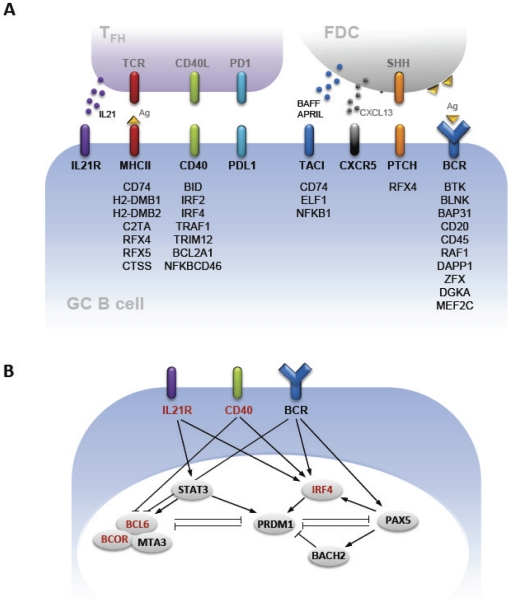
IRF8 (Interferon Regulatory Factor 8) is a transcription factor expressed throughout B cell differentiation except for mature plasma cells. Previous studies showed it is part of the transcriptional network governing B cell specification and commitment in the bone marrow, regulates the distribution of mature B cells into the splenic follicular and marginal zone compartments, and is expressed at highest levels in germinal center (GC) B cells. Here, we investigated the transcriptional programs and signaling pathways affected by IRF8 in human and mouse GC B cells as defined by ChIP-chip analyses and transcriptional profiling. We show that IRF8 binds a large number of genes by targeting two distinct motifs, half of which are also targeted by PU.1. Over 70% of the binding sites localized to proximal and distal promoter regions with ∼25% being intragenic. There was significant enrichment among targeted genes for those involved in innate and adaptive immunity with over 30% previously defined as interferon stimulated genes. We also showed that IRF8 target genes contributes to multiple aspects of the biology of mature B cells including critical components of the molecular crosstalk among GC B cells, T follicular helper cells, and follicular dendritic cells.


Conflict of interest statement

Competing Interests: The authors have declared that no competing interests exist.

Figures

Figure 1
Figure 1. Identification of IRF8 targets in human cell lines of GC B cell origin.
Labeled IRF8 ChIP samples and input samples from the three human cell lines of GC B cell origin were applied to Nimblegen HG18 385 k arrays and peak signals were analyzed by sliding window algorithm with threshold of FDR<0.01. (A) Venn diagram of IRF8 targets in three cell lines. Numbers in parentheses indicate the numbers of targets identified in each line. Internal numbers indicate targets common to two or all three lines. (B) Distribution of IRF8-bound sites relative to the transcription start site (TSS) of target genes. (C) Representative IRF8 binding from ChIP-chip in four cell lines. Binding of IRF8 to the TLR4 promoter is shown as an example. Fold change is calculated from relative fold enrichment of IRF8 ChIP signal to input signal. Dashed line shows TSS.
Figure 2
Figure 2. Validation of IRF8 ChIP-chip and functional classification of IRF8 targets
(A) ChIP-qPCR validation using primer pairs surrounding the putative binding sites identified by ChIP-chip. For each locus, the fold enrichment comparing IRF8 ChIP DNA to input DNA is represented in the bar graph. The heatmap (lower panel) shows fold enrichment obtained from ChIP-chip. (B) Categorization of IRF8 targets by Gene Ontology (GO). Percents of genes in each category in the whole array or in the set of IRF8 targets are shown. p-values indicate significance of the enrichment for IRF8 targets in each GO category. (C) Motif analysis for IRF8 ChIP hits. Over-represented motifs were identified by TRAWLER and MEME. (D) A Venn diagram of IRF8 targets and interferon-responsive genes. The Interferome DB was used for identifying interferon-responsive genes.
Figure 3
Figure 3. Identification of IRF8 and PU.1 targets in mouse cell lines of GC B cell origin.
Labeled IRF8 ChIP samples and input samples were applied to Nimblegen MM8 385 k arrays and peak signals were identified by sliding window algorithm with threshold of FDR<0.01. (A) A Venn diagram for IRF8 targets. Numbers in parentheses indicate the number of IRF8 targets identified in each line. Venn diagram shows the number of IRF8 targets that belong to each area. (B) Western blots for IRF8 and PU.1 in the three cell lines. (C) Distribution of IRF8 ChIP hits by chromosomal location relative to transcription start sites (TSS). (D) Distribution of IRF8 binding related to the annotated structure of associated genes (top). The frequencies of IRF8 hits in the sub-structure of intragenic locations (bottom).
Figure 4
Figure 4. Transciptome analysis of mouse DLBCL cell lines stably expressing siIRF8.
Total RNAs from NFS-202 cell lines stably expressing siIRF8 and control cell lines were applied to NIAID mouse expression arrays. (A) Significant Analysis of Microarray (SAM) plots for identification of differentially expressed genes in knock-down cell lines. Both up- and down-regulated genes were identified with FDR<0.01. (B) qPCR validation of differentially expressed genes from microarray analysis. Fold change of siIRF8 cell lines vs. control cell lines were plotted against fold change in microarray. Values are in log2 scale. Linear regression analysis was performed (p<0.0001). (C) Functional classification of significant genes in IRF8 knock-down cell lines. Fisher's exact test was performed to identify significantly enriched biological categories using Ingenuity Pathway Analysis (IPA). Log-transformed p-values from Fisher's exact test are shown on the x-axis. (D) GSEA analysis of mRNA expression profiles for IRF8 knock-down cells vs. control cells. Relative expression was rank-ordered by fold change of five replicate IRF8 knock-down samples vs. five replicate control samples. Genes associated with IRF8 binding sites (IRF8 ChIP targets) were strongly correlated with IRF8 expression level. The color bar at the bottom indicates up-regulated (red) and down-regulated (blue) genes. (E) Distribution of PU.1 ChIP hits by chromosomal location relative to transcription start sites (TSS). PU.1 ChIP-chip analyses were done using NFS-201 and NFS-202 cells that express PU.1 and NFS-205 cells that are PU.1-negative. Labeled PU.1 ChIP samples and input samples were applied to Nimblegen MM8 385 k arrays and peak signals were analyzed by sliding window algorithm with threshold of FDR<0.01. (F) Classification of mouse IRF8 targets with altered expression by siIRF8 in relation to PU.1 binding to the gene. A Venn diagram of genes bound by IRF8 from ChIP-chip and genes that were significantly altered in IRF8 knock-down cells as indicated by gene expression microarray (false discovery rate<0.01). Those IRF8 targets with differential expression were classified into two groups based upon the observation of PU.1 binding from ChIP-chip. The top over-represented motifs were identified in two groups of IRF8 ChIP-hits by TRAWLER using mouse 1 kb promoter set as background.
Figure 5
Figure 5. IRF8 targets common in human and mouse.
IRF8 targets common in both human and mouse were identified by intersecting human and mouse ChIP-chip analysis. These 51 targets are listed along with data on fold enrichment of IRF8 ChIP vs. input. Data obtained from human cell lines LY1, ODH1 and VAL are shown in the left most heatmap. IRF8 ChIP-chip data from mouse cell lines NFS-201, NFS-202 and NFS-205 are shown in blue. Fold enrichment of PU.1 ChIP vs. input from NFS-201 and NFS-202 are shown in purple. IRF8 expression (Expr) column indicates expression levels of genes identified as activated or repressed by IRF8. Reported responsiveness of genes to interferon type I, II, or III is shown in pale blue in the rightmost map. Numbers in ChIP-chip data are fold enrichment and those in expression array are fold change of control vs. siIRF8 cell lines.
Figure 6
Figure 6. MHC II expression in germinal center B cells of IRF8 knock out mice.
(A) MHC class II expression in GC B cells in IRF8 KO and WT mice. Representative histogram for MHC class II expression in GC B cells (left panel). Dot plot shows significant difference in MHCII expression between two groups. *, p<0.05 from Mann-Whitney test. (B) MHC class II expression in in vitro stimulated B cells. Purified B cells were stimulated with IFNγ for 2days. Transcript level of Irf8 were determined by qPCR at days 1 and 2 after stimulation (left panel). Transcript levels of C2ta and H2-Ab1 in wt and KO B cells determined by qPCR are shown (right panel). Data from four different mice in each group were examined by t-test. *, p<0.05.
Figure 7
Figure 7. The roles of IRF8 in GC B cells.
IRF8 targets in B cells were presented in context of signaling pathways in GC.(A) Cross-talk between B cells and T cells and follicular DC in GC. IRF8 targets in B cells are shown together with ligands or products from TFH or FDC cells. (B) Signaling downstream of IL21R, CD40, and BCR. IRF8 targets are shown in red.

References

    1. Marecki S, Fenton M. PU.1/interferon regulatory factor interactions. Cell Biochemistry and Biophysics. 2000;33:127–148. - PubMed
    1. Xiong S, She H, Takeuchi H, Han B, Engelhardt JF, et al. Signaling Role of Intracellular Iron in NF-κB Activation. Journal of Biological Chemistry. 2003;278:17646–17654. - PubMed
    1. Dror N, Alter-Koltunoff M, Azriel A, Amariglio N, Jacob-Hirsch J, et al. Identification of IRF-8 and IRF-1 target genes in activated macrophages. Molecular Immunology. 2007;44:338–346. - PubMed
    1. Marquis J-F, Kapoustina O, Langlais D, Ruddy R, Dufour CR, et al. Interferon Regulatory Factor 8 Regulates Pathways for Antigen Presentation in Myeloid Cells and during Tuberculosis. PLoS Genet. 2011;7:e1002097. - PMC - PubMed
    1. Kubosaki A, Lindgren G, Tagami M, Simon C, Tomaru Y, et al. The combination of gene perturbation assay and ChIP-chip reveals functional direct target genes for IRF8 in THP-1 cells. Molecular Immunology. 2010;47:2295–2302. - PubMed

Publication types

MeSH terms

Substances