. 2011;6(11):e27505.
doi: 10.1371/journal.pone.0027505. Epub 2011 Nov 11.

Up-regulation of A1M/α1-microglobulin in skin by heme and reactive oxygen species gives protection from oxidative damage

Affiliations

Up-regulation of A1M/α1-microglobulin in skin by heme and reactive oxygen species gives protection from oxidative damage

Magnus G Olsson et al. PLoS One. 2011.

Abstract

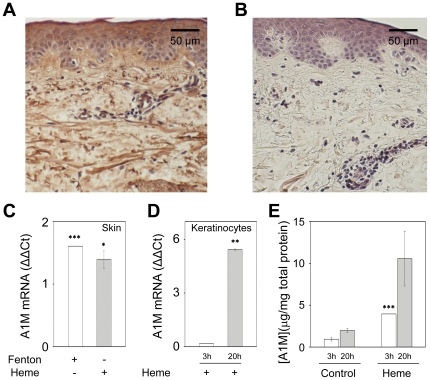
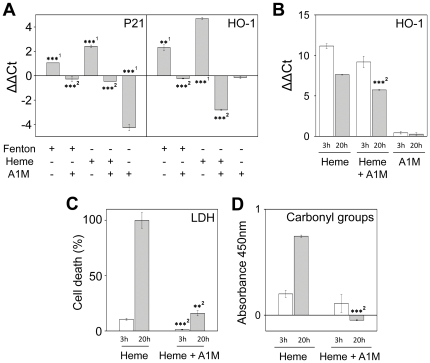
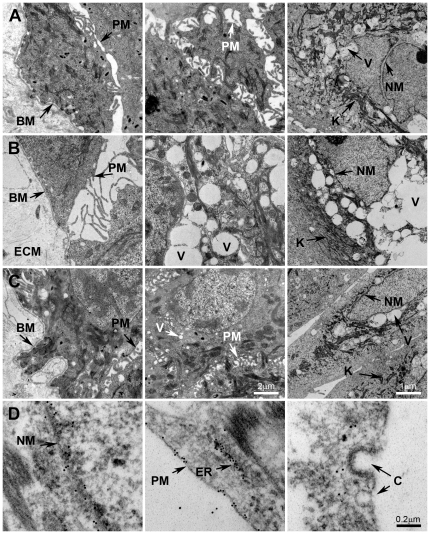
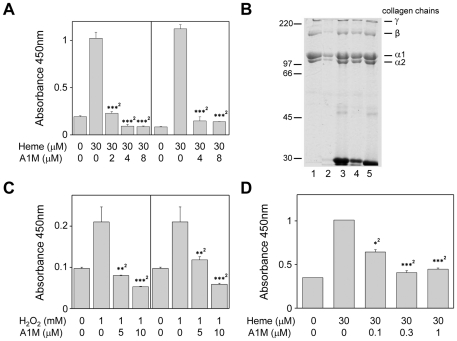
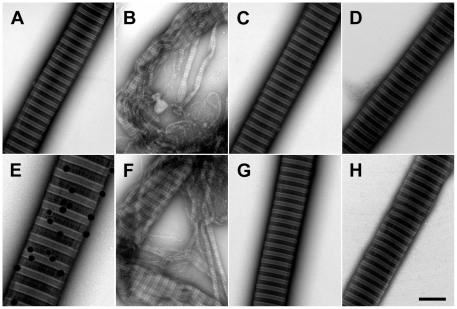
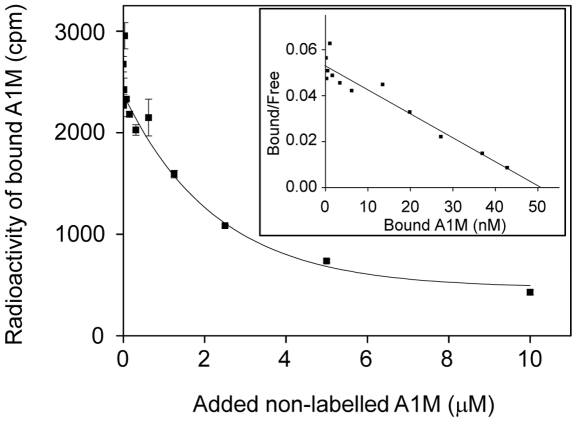
During bleeding the skin is subjected to oxidative insults from free heme and radicals, generated from extracellular hemoglobin. The lipocalin α(1)-microglobulin (A1M) was recently shown to have reductase properties, reducing heme-proteins and other substrates, and to scavenge heme and radicals. We investigated the expression and localization of A1M in skin and the possible role of A1M in the protection of skin tissue from damage induced by heme and reactive oxygen species. Skin explants, keratinocyte cultures and purified collagen I were exposed to heme, reactive oxygen species, and/or A1M and investigated by biochemical methods and electron microscopy. The results demonstrate that A1M is localized ubiquitously in the dermal and epidermal layers, and that the A1M-gene is expressed in keratinocytes and up-regulated after exposure to heme and reactive oxygen species. A1M inhibited the heme- and reactive oxygen species-induced ultrastructural damage, up-regulation of antioxidation and cell cycle regulatory genes, and protein carbonyl formation in skin and keratinocytes. Finally, A1M bound to purified collagen I (K(d) = 0.96×10(-6) M) and could inhibit and repair the destruction of collagen fibrils by heme and reactive oxygen species. The results suggest that A1M may have a physiological role in protection of skin cells and matrix against oxidative damage following bleeding.


Conflict of interest statement

Competing Interests: Preelumina AB is one of the funders of this study. This does not alter the authors' adherence to all the PLoS ONE policies on sharing data and materials.

Figures

Figure 1
Figure 1. Histochemical distribution and expression of A1M.
A. The sections (x10) were stained for A1M using monoclonal mouse anti-A1M BN11.10 (10 µg/mL) followed by peroxidase/diaminobenzidine tetrahydrochloride incubation as described in Materials and Methods. B. Control sections (x10) incubated without primary antibody. C, D and E. Human skin explants (1×10×2 mm) or primary keratinocytes were cultured in serum-free medium as described in Materials and Methods. C. Skin explants were incubated with 20 µM (NH4)Fe(SO4)2+200 µM ascorbate+40 µM H2O2 ( = Fenton; white bar) or 20 µM heme (grey) for a period of 20 hours. D. Keratinocytes were incubated with 20 µM heme for a period of 3 (white) or 20 (grey) hours. Total RNA was extracted from homogenized cells, cDNA was prepared using reverse transcription and expression of A1M was analyzed using real-time PCR as described in Materials and Methods. A1M threshold cycle values were normalized against G3DPH and ΔΔCt was calculated by normalizing against control samples which were incubated with buffer only for the same time-periods. Consequently, ΔΔCt-values of all controls are zero and correspond to the baseline. E. Keratinocytes were cultured in serum-free medium as described in Materials and Methods. The cells were then incubated with 20 µM heme for a period of 3 (white) or 20 (grey) hours. The cells were homogenized and the A1M concentration was determined using RIA as described in Materials and Methods. The total protein concentrations were determined with Bradford protein assay as described in Materials and Methods. Results are from triplicate experiments and are presented as mean ± SEM. Statistical comparison with control cultures was made using Students t test. * P<0.05 ** P<0.01, *** P<0.001.
Figure 2
Figure 2. A1M inhibits heme- and ROS-induced oxidation in skin and keratinocytes.
Human skin explants (1×10×2 mm) or primary keratinocytes were cultured in serum-free medium as described in Materials and Methods. A. Skin explants were incubated with 20 µM (NH4)Fe(SO4)2+200 µM ascorbate+40 µM H2O2 ( = Fenton), 20 µM heme with or without 10 µM A1M, or 10 µM A1M alone, for a period of 20 hours. B. Keratinocytes were incubated with 20 µM heme with or without 10 µM A1M, or 10 µM A1M alone, for a period of 3 (white) or 20 (grey) hours. Total RNA was extracted from homogenized cells; cDNA was prepared using reverse transcription and quantified by real-time PCR as described in Materials and Methods. p21 and HO-1 threshold cycle values were normalized against G3DPH and ΔΔCt were calculated by normalizing against non-exposed samples. Consequently, ΔΔCt-values of all controls are zero and correspond to the baseline. C and D. Keratinocytes were cultured in serum-free medium as described in Materials and Methods. The cells were then incubated with 20 µM heme with or without 10 µM A1M for a period of 3 (white) or 20 (grey) hours. C. The amount of LDH present in the culture medium was measured using CytoTox 96® Non-Radioactive Cytotoxicity Assay as described in Materials and Methods. D. The cells were harvested and the protein carbonyl group concentrations were measured by ELISA as described in Materials and Methods. Results are from triplicate experiments and are presented as mean ± SEM. Statistical comparison between groups was made using Students t test. * P<0.05 ** P<0.01, *** P<0.001. 1 Statistical comparison vs. control, 2 statistical comparison with heme or Fenton treatment.
Figure 3
Figure 3. Human normal skin (Left and middle panel) was dissected into 1×10×2 mm pieces and placed in Keratinocyte SFM culture medium.
Human primary keratinocytes were cultured in Keratinocyte SFM medium (Right panel). Skin and keratinocytes were then incubated for 20 hours at RT with buffer only (A), with 20 µM heme (B) or with 20 µM heme and 10 µM A1M (C, D). Immunolabeling of thin sections with gold-labeled anti-A1M were performed (D). The samples were prepared as described in Materials and Methods and observed in a Jeol JEM 1230 electron microscope, operated at 80 kV accelerating voltage. Images were recorded with a Gatan Multiscan 791 charge-coupled device camera. BM =  basement membrane, PM = plasma membrane, NM =  nucleus membrane, V =  vacuoles, ECM =  extracellular matrix, K =  keratin, ER =  endoplasmatic reticulum, C =  caveoli. Scale bar in C (middle) indicate 2 µm (is applicable for Figure A, B and C, left and middle), in C (right) indicate 1 µm (is applicable for A, B and C, right) and D (right) indicate 0.2 µm (is applicable for D, left, middle and right).
Figure 4
Figure 4. A1M inhibits and repairs heme- and ROS-induced oxidation of collagen I in vitro. A (Left).
Collagen I, coated to microtiter plates, was incubated with 30 µM heme alone or in the presence of A1M (2, 4, or 8 µM). (Right) Collagen, coated to microtiter plates, was pre-incubated with 4 or 8 µM A1M and washed before the addition of 30 µM heme. After 4 hours incubation the protein carbonyl group concentration was measured using ELISA as described in Materials and Methods. B. Collagen (5 µM) was incubated with PBS (lane 1), 160 µM H2O2 (lane 2), 160 µM H2O2+10 µM A1M (lane 3), 160 µM H2O2+3 µM A1M (lane 4) or only 10 µM A1M (lane 5). After 2 hours at 25°C, the samples were separated on 8% SDS-PAGE and stained with Coomassie Brilliant Blue R-250. C (Left). Collagen, coated to microtiter plates, was incubated for 4 hours with 1 mM H2O2 alone, or a mixture containing 1 mM H2O2 plus 5 µM or 10 µM A1M. (Right) Collagen, coated to microtiter plates, was pre-incubated with A1M (5 or 10 µM) and washed before the addition of 1 mM H2O2. The protein carbonyl group concentration was measured using ELISA as described in Materials and Methods. D. Collagen, coated to microtiter plates, was oxidized by incubation with 30 µM heme for 17 h. After washing, 0.1, 0.3 or 1 µM A1M was added, and incubated for 2 hours. The protein carbonyl group concentration was measured by ELISA as described in Materials and Methods. Statistical comparison between groups was made using Students t test. * P<0.05 ** P<0.01, *** P<0.001. 2 statistical comparison with heme or Fenton treatment.
Figure 5
Figure 5. A1M inhibits destruction of collagen fibrils.
Collagen was incubated with buffer for 24 hours at RT to allow fibrillation. Fibrils were then incubated for a second 24-hour period at RT with heme (B, 20 µM), Fenton-reaction mixture (F, 100 µM Fe3+, 1.0 mM ascorbate, 200 µM H2O2) or buffer only (A), either with or without A1M (C and G,10 µM). Fibrils incubated without A1M during the second 24 hour period were then incubated for a third 24 hour period with buffer or 10 µM A1M (D and H). The samples were then adsorbed for 1 min onto carbon-coated grids. To study binding of A1M to collagen (E), collagen was allowed to form fibrils by incubation with buffer and then incubated with gold-labeled A1M for 1 hour at RT. The samples were analyzed in a Jeol 1200 EX electron microscope operated at 60 kV accelerating voltage. The scale bar indicates 50 nm in A–D and F-H and100 nm in E.
Figure 6
Figure 6. Binding of A1M to collagen I.
Purified collagen I-monomers were coated to microtiter plates and incubated with 125I-labelled A1M in the presence of increasing amounts of non-labeled A1M. After washing, the radioactivity bound to the microtiter plate walls was plotted against the total concentration of A1M. The binding displacement-curve is shown with the corresponding Scatchard plot (insert). The strength of the binding was estimated using Scatchard analysis, giving a Kd of 0.96×10⁻⁶ M. Each point represents the mean ± SEM of three determinations.

Similar articles

Cited by

References

    1. Masaki H. Role of antioxidants in the skin: Anti-aging effects. Journal of Dermatological Science. 2010;58:85–90. - PubMed
    1. Orciani M, Gorbi S, Benedetti M, Di Benedetto G, Mattioli-Belmonte M, et al. Oxidative stress defense in human-skin-derived mesenchymal stem cells versus human keratinocytes: Different mechanisms of protection and cell selection. Free Radical Biology and Medicine. 2010;49:830–838. - PubMed
    1. Packer L, Valacchi G. Antioxidants and the response of skin to oxidative stress: Vitamin E as a key indicator. Skin Pharmacology and Applied Skin Physiology. 2002;15:282–290. - PubMed
    1. Trouba KJ, Hamadeh HK, Amin RP, Germolec DR. Oxidative stress and its role in skin disease. Antioxidants & Redox Signaling. 2002;4:665–673. - PubMed
    1. Ray G, Husain SA. Oxidants, antioxidants and carcinogenesis. Indian J Exp Biol. 2002;40:1213–1232. - PubMed

Publication types

MeSH terms