. 2011;6(11):e27553.
doi: 10.1371/journal.pone.0027553. Epub 2011 Nov 9.

Gene expression profile change and associated physiological and pathological effects in mouse liver induced by fasting and refeeding

Affiliations

Gene expression profile change and associated physiological and pathological effects in mouse liver induced by fasting and refeeding

Fang Zhang et al. PLoS One. 2011.

Abstract

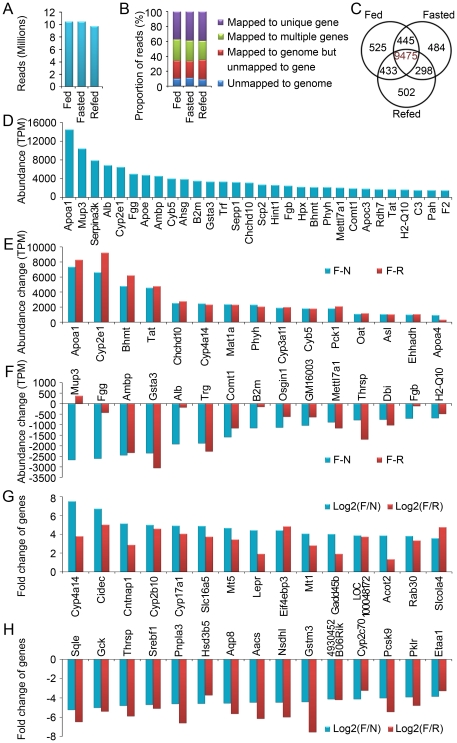
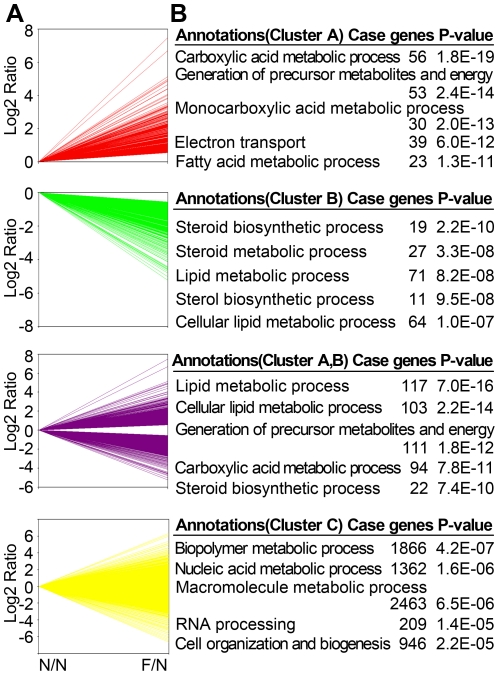
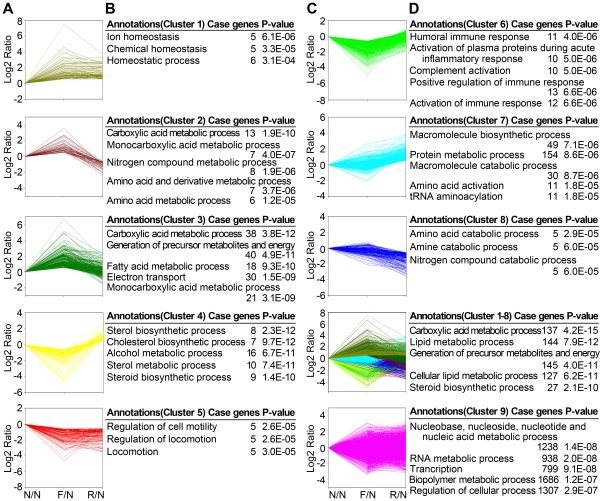
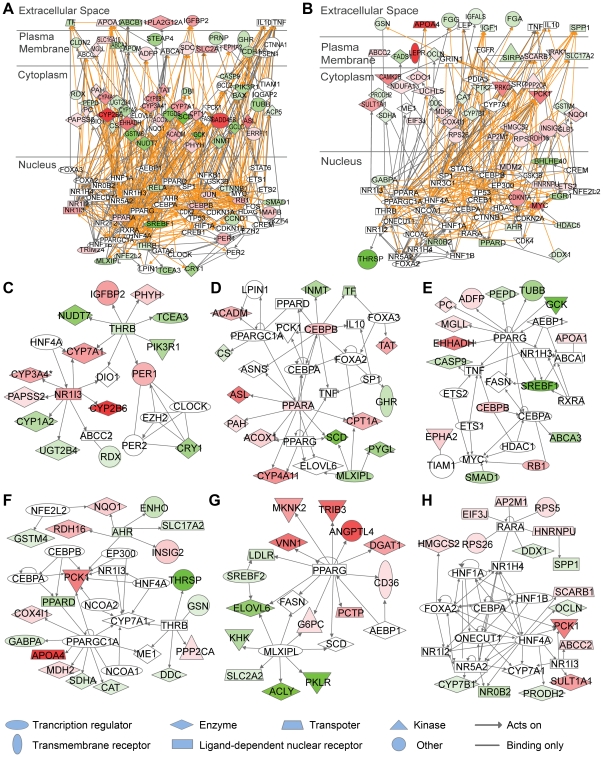
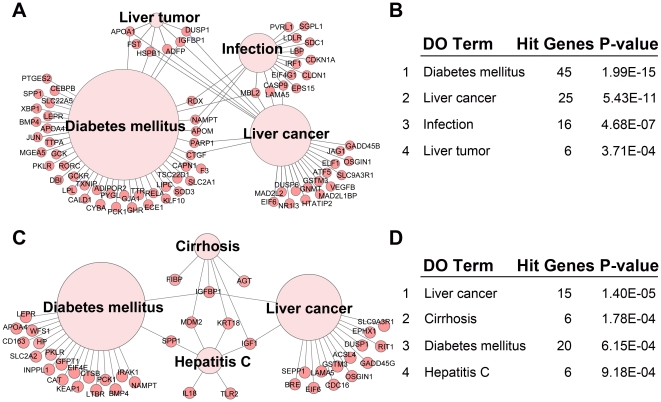
Food availability regulates basal metabolism and progression of many diseases, and liver plays an important role in these processes. The effects of food availability on digital gene expression profile, physiological and pathological functions in liver are yet to be further elucidated. In this study, we applied high-throughput sequencing technology to detect digital gene expression profile of mouse liver in fed, fasted and refed states. Totally 12162 genes were detected, and 2305 genes were significantly regulated by food availability. Biological process and pathway analysis showed that fasting mainly affected lipid and carboxylic acid metabolic processes in liver. Moreover, the genes regulated by fasting and refeeding in liver were mainly enriched in lipid metabolic process or fatty acid metabolism. Network analysis demonstrated that fasting mainly regulated Drug Metabolism, Small Molecule Biochemistry and Endocrine System Development and Function, and the networks including Lipid Metabolism, Small Molecule Biochemistry and Gene Expression were affected by refeeding. In addition, FunDo analysis showed that liver cancer and diabetes mellitus were most likely to be affected by food availability. This study provides the digital gene expression profile of mouse liver regulated by food availability, and demonstrates the main biological processes, pathways, gene networks and potential hepatic diseases regulated by fasting and refeeding. These results show that food availability mainly regulates hepatic lipid metabolism and is highly correlated with liver-related diseases including liver cancer and diabetes.


Conflict of interest statement

Competing Interests: The authors have declared that no competing interests exist.

Figures

Figure 1
Figure 1. Sequencing and mapping messages of mouse liver mRNA profiling under feeding, fasting and refeeding conditions.
(A) Reads of high quality clean tags from high-throughput sequencing experiments. Total liver RNA from C57BL/6 mice fed ad libitum with chow, fasted for 24 hr, or fasted for 24 hr and refed for 24 hr was used to prepare the high-throughput sequencing library. (B) Proportions of high quality clean tags unmapped and/or mapped to unique genes, multiple genes and genome. (C) Gene numbers between feeding, fasting and refeeding states. (D) The top 30 abundant genes in normal feeding mouse liver from the high-throughput sequencing were quantified and shown as transcripts per million (TPM). (E) The top 15 abundance change of genes upregulated by fasting, and their abundance change following refeeding. N, gene abundance under normal feeding condition; F, gene abundance under fasting condition; R, gene abundance under refeeding condition. (F) The top 15 abundance changes of genes downregulated by fasting, and their abundance change following refeeding. (G) The top 15 fold change of genes upregulated by fasting, and their fold change following refeeding. (H) The top 15 fold change of genes downregulated by fasting, and their fold change following refeeding.
Figure 2
Figure 2. Genes and the related biological processes in mouse liver regulated by fasting.
(A) The 8815 selected genes as described in Materials and Methods and Figure S3A were separated into three distinct clusters according to the genes upregulated, downregulated, or unaffected by fasting compared with normal feeding. Red lines indicate Cluster A including 472 genes upregulated by fasting. Green lines indicate Cluster B including 1037 genes downregulated by fasting. Purple lines indicate 1509 genes affected by fasting, which include all genes in Cluster A and B. Yellow lines indicate Cluster C including 7306 genes unaffected by fasting. N, gene abundance under normal feeding condition; F, gene abundance under fasting condition. (B) The clustered genes were assigned to different biological processes based on Gene Ontology using the web tool DAVID. The top 5 biological functions and the case genes in each cluster ranked by P-value were listed (P<0.001, case genes ≥10).
Figure 3
Figure 3. Genes and the related biological processes in mouse liver regulated by fasting and refeeding.
(A, C) The 8815 selected genes as described in Materials and Methods and Figure S3A were separated into nine distinct clusters according to the genes upregulated, downregulated or unaffected by fasting and refeeding compared with normal feeding. Cluster 1 included 83 genes upregulated by fasting and refeeding. Cluster 2 included 50 genes upregulated by fasting and downregulated by refeeding. Cluster 3 included 339 genes upregulated by fasting and unaffected by refeeding. Cluster 4 included 128 genes downregulated by fasting and upregulated by refeeding. Cluster 5 included 123 genes downregulated by fasting and refeeding. Cluster 6 included 786 genes downregulated by fasting and unaffected by refeeding. Cluster 7 included 618 genes unaffected by fasting and upregulated by refeeding. Cluster 8 included 178 genes unaffected by fasting and downregulated by refeeding. Cluster 9 included 6510 genes unaffected by fasting and refeeding. N, gene abundance under normal feeding condition; F, gene abundance under fasting condition; R, gene abundance under refeeding condition. (B, D) The clustered genes were assigned to different biological processes based on Gene Ontology using the web tool DAVID. The top biological processes and the case genes in each cluster ranked by P-value were listed (P<0.001, case genes ≥5).
Figure 4
Figure 4. Network representation of the biological processes in mouse liver regulated by fasting and refeeding.
(A) The top 5 connected networks in 1125 genes upregulated or downregulated by fasting and recovered to normal feeding states after refeeding. The gene networks were analyzed by Ingenuity. Genes upregulated or downregulated by fasting are represented in red or green color respectively. The top 3 networks were shown in (C), (D) and (E). (C) Network of Drug Metabolism, Small Molecule Biochemistry and Endocrine System Development and Function. (D) Network of Lipid Metabolism, Small Molecule Biochemistry and Molecular Transport. (E) Network of Lipid Metabolism, Molecular Transport and Small Molecule Biochemistry. (B) The top 5 connected networks of 1180 genes upregulated or downregulated after refeeding compared to normal feeding. The top 3 networks were shown in (F), (G) and (H). (F) Network of Lipid Metabolism, Small Molecule Biochemistry and Gene Expression. (G) Network of Lipid Metabolism, Small Molecule Biochemistry and Molecular Transport. (H) Network of Hepatic System Disease, Lipid Metabolism and Molecular Transport.
Figure 5
Figure 5. Genes regulated by fasting or refeeding linked to different liver diseases.
(A) The map of top 4 liver diseases enriched with the genes regulated by fasting. 1509 genes upregulated or downregulated by fasting were assigned to different diseases using the web tool FunDO. The sizes of the disease nodes are proportional to the number of enriched genes. (B) The number of hit genes and P-value of the top 4 enriched liver diseases in (A). (C) The map of top 4 liver diseases enriched with the genes upregulated or downregulated after refeeding. 1180 genes affected by refeeding were assigned to different diseases using the web tool FunDO. (D) The number of hit genes and P-value of the top 4 enriched liver diseases in (C).

References

    1. Robson AA. Preventing diet induced disease: bioavailable nutrient-rich, low-energy-dense diets. Nutr Health. 2009;20:135–166. - PubMed
    1. Keys A. The residues of malnutrition and starvation. Science. 1950;112:371–373. - PubMed
    1. Susser ES, Lin SP. Schizophrenia after prenatal exposure to the Dutch Hunger Winter of 1944-1945. Arch Gen Psychiatry. 1992;49:983–988. - PubMed
    1. St Clair D, Xu M, Wang P, Yu Y, Fang Y, et al. Rates of adult schizophrenia following prenatal exposure to the Chinese famine of 1959-1961. Jama. 2005;294:557–562. - PubMed
    1. Johnstone AM. Fasting - the ultimate diet? Obes Rev. 2007;8:211–222. - PubMed

Publication types