. 2011 Mar;1(1):59-69.
doi: 10.1556/EuJMI.1.2011.1.8.

CONTINUOUS REPOPULATION OF LYMPHOCYTE SUBSETS IN TRANSPLANTED MYCOBACTERIAL GRANULOMAS

Affiliations

CONTINUOUS REPOPULATION OF LYMPHOCYTE SUBSETS IN TRANSPLANTED MYCOBACTERIAL GRANULOMAS

H A Schreiber et al. Eur J Microbiol Immunol (Bp). 2011 Mar.

Abstract

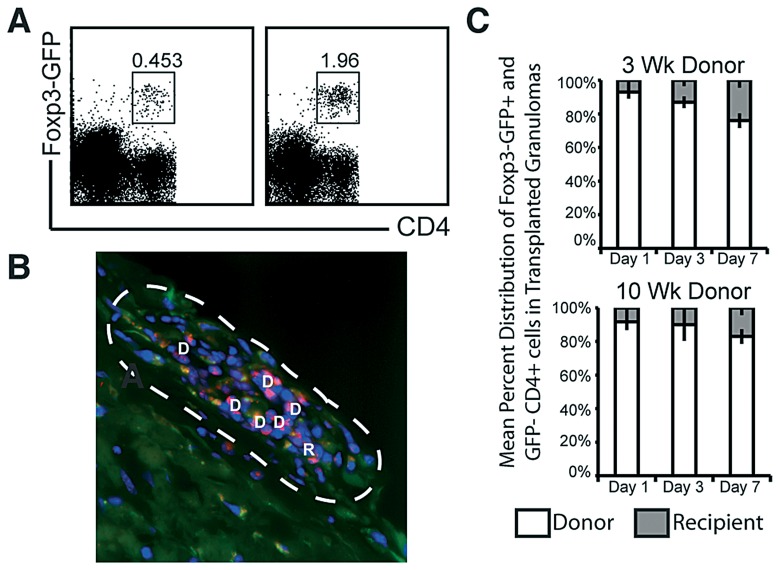
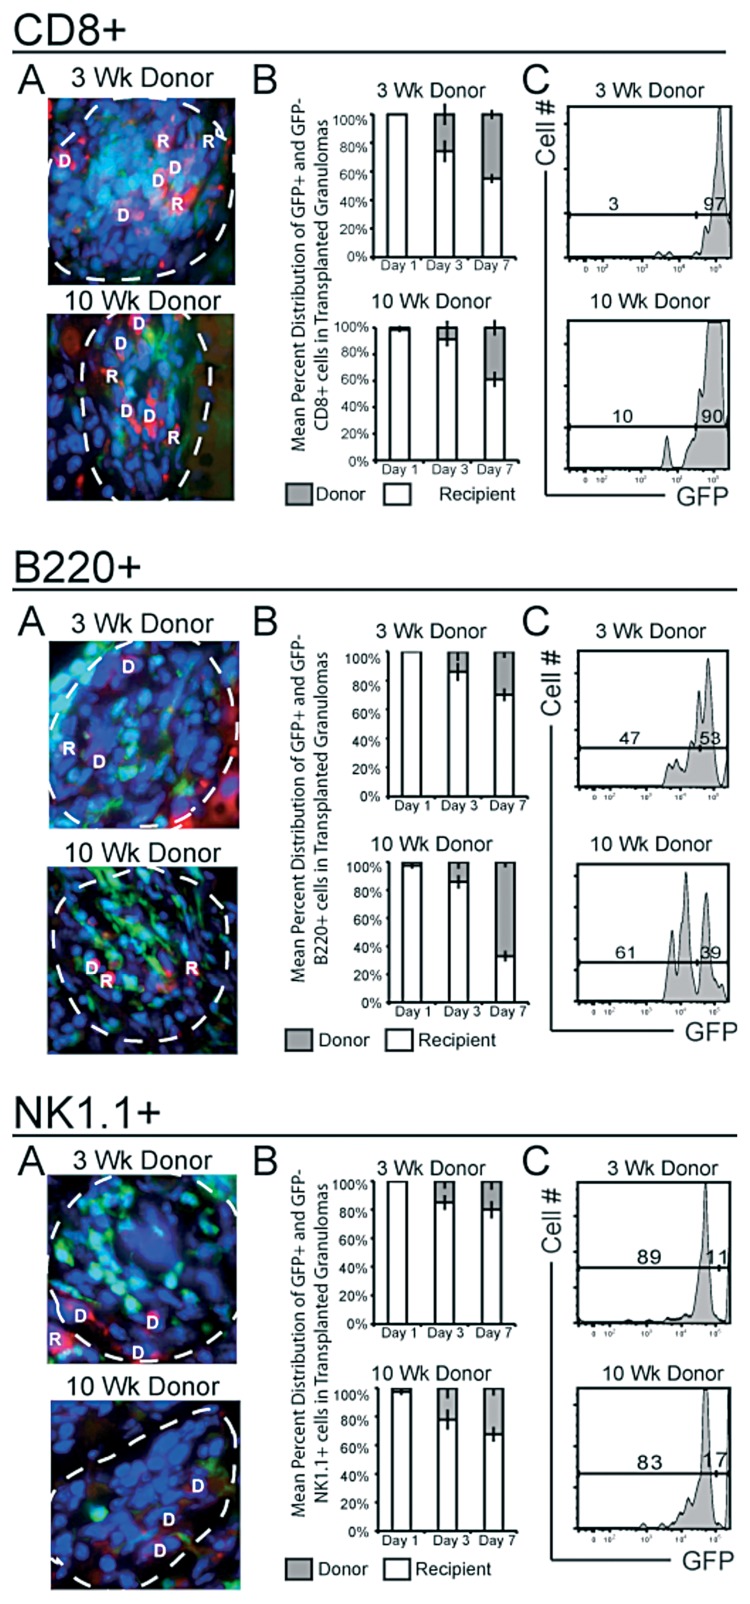
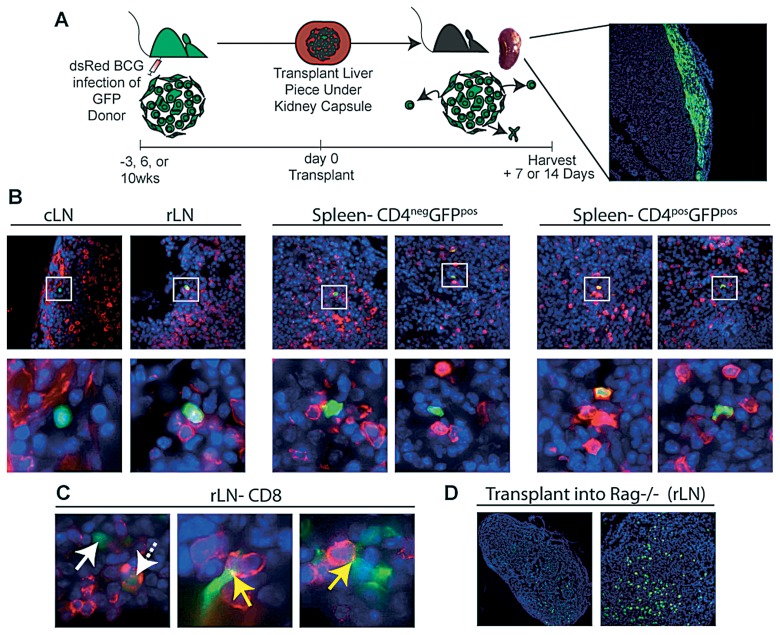
Granulomas are the interface between host and mycobacteria, and are crucial for the surivival of both species. While macrophages are the main cellular component of these lesions, different lymphocyte subpopulations within the lesions also play important roles. Lymphocytes are continuously recruited into these inflammatory lesions via local vessels to replace cells that are either dying or leaving; however, their rate of replacement is not known. Using a model of granuloma transplantation and fluorescently labeled cellular compartments we report that, depending on the subpopulation, 10-80%, of cells in the granuloma are replaced within one week after transplantation. CD4(+) T cells specific for Mycobacterium antigen entered transplanted granulomas at a higher frequency than Foxp3(+) CD4(+) T cells by one week. Interestingly, a small number of T lymphocytes migrated out of the granuloma to secondary lymphoid organs. The mechanisms that define the differences in recruitment and efflux behind each subpopulation requires further studies. Ultimately, a better understanding of lymphoid traffic may provide new ways to modulate, regulate, and treat granulomatous diseases.


Figures

Fig. 1.
Fig. 1.
Lymphocyte subsets in 3- and 10-week Mycobacterium bovis strain Calmette-Guerin-induced granulomas. C57BL/6 mice were systemically infected intraperitoneally with BCG. Three and ten weeks post-infection livers were harvested, and granuloma-infiltrating cells were isolated. For P25 experiments, 5×10⁵ dsRed Vβ11+CD4+ cells from the P25 Tg mouse were adoptively transferred into infected mice one week prior to harvest. FACS analysis of CD8+ and CD4+ (top row), P25 (middle row) and NK1.1+ and B220+ (bottom row) populations in liver granulomas. Subset gating scheme shown above is used throughout manuscript. Plots obtained from live cells gate of SSC versus FSC. Plots representative of at least 3–5 independent experiments
Fig. 2.
Fig. 2.
Transplantation of uninfected, 3- and 10-week BCG infected colorless liver tissue under the kidney capsule of GFP recipient mice. A, Experimental Scheme. B, Fluorescent microscopy of kidney sections 3 days post transplant of uninfected, 3- and 10-week BCG infected colorless liver tissue. Images taken at ×10 magnification. GFP (green) and DAPI nuclear stain (blue)
Fig. 3.
Fig. 3.
Migration of recipient GFP+CD4+ T cells into transplanted granulomas in 3- and 10-week Mycobacterium-infected donor liver tissue. Liver tissue, containing granulomas from 3- (A–D) and 10-week (E–H) mycobacterial infection, was transplanted underneath the kidney capsule of uninfected GFP recipients. A & E, Digitally magnified ×1000 fluorescent microscopy images taken of transplanted specimen 1, 3, and 7 days post transplant of 3- and 10-week BCG-infected donor liver. Granulomas outlined with white dashed lines, recipient cells (green), donor CD4 (red), recipient CD4 (orange/yellow) and DAPI nuclear stain (blue). Granuloma-associated CD4+ T cells were designated to be either donor (D) or recipient (R)-derived, based on CD4-GFP co staining. B & F, Mean distribution of all donor (white bars) and recipient (grey bars) CD4 T cells per granuloma 1, 3 and 7 days post transplant. CD4 distribution was determined from 10–15 granulomas per time point. C & G, 1, 3 and 7 days post transplant, transplanted donor liver tissue was excised and prepared for flow cytometry. Upper dot-plot panels, CD8 and CD4 surface staining. Lower histograms, GFP distribution of CD4+ gating shown in upper panels. Gating generated from GFP+ controls. D & H, Mean absolute number of infiltrating CD4+GFP+ T cells per gram of total transplanted tissue. Data generated from 2–3 independent experiments; error bars represent SEM
Fig. 4.
Fig. 4.
Migration of Thy1.1 P25 CD4+ T cells into 3- and 10-week infected donor tissue. Briefly, Thy1.2 C57Bl/6 liver tissue from 3- and 10-week infected mice was transplanted under the kidney capsule of P25 Thy1.1 Tg recipients. A, Fluorescent microscopy images of transplanted kidney 7 days post transplant. Images digitally magnified from images taken at ×1000 magnification white-dashed line indicates border of granuloma. Red indicates donor anti-CD4 surface stain (D), and green or yellow/orange indicate recipient Thy1.1+ cells (R). B, Mean percent composition of donor CD4+Thy1.1 cells (white bars) and recipient CD4+Thy1.1+ cells (grey bars) in transplant granuloma. C, 7 days later donor tissue was removed and stained with anti-Thy1.1 and Vβ11 to locate Tg T cells. D, Absolute number of infiltrating P25+ cells per gram of transplanted tissue. Error bars indicate ±SEM
Fig. 5.
Fig. 5.
Migration of regulatory T cells into 3- and 10-week infected donor tissue. A, FACs plot of three (left plot) and ten (right plot) week infected Foxp3-GFP reporter mice. B, Liver tissue from 3-week infected colorless mice was transplanted under the kidney capsule of Foxp3-GFP reporter recipients. Fluorescent microscopy image of transplanted kidney 7 days post transplant. Image digitally magnified from images taken at ×1000 magnification white-dashed line indicates border of granuloma. Red indicates donor anti-CD4 surface stain (D), and green or yellow/orange indicate recipient Foxp3+ cells (R). C, Mean percent composition of donor CD4+GFP cells (white bars) and recipient CD4+Foxp3-GFP+ cells (grey bars) in transplant granuloma
Fig. 6.
Fig. 6.
Migration of recipient GFP+ CD8+ T cells, NK1.1+ and B220+ cells into transplanted granulomas within 3- and 10-week Mycobacterium-infected donor liver tissue. Analysis of GFP+ cellular migration into transplanted 3- and 10-week granuloma-containing infected donor liver tissue was performed in the same way as CD4+ analysis in Fig 3. A, Digitally magnified ×1000 fluorescent microscopy images taken of transplanted specimen 7 days post transplant of 3- and 10-week BCG-infected donor liver. B, Mean percent distribution of GFP+ (R) and GFP (D) CD8+ T cells, NK1.1+ and B220+ in transplanted granulomas. C, GFP distribution of CD8+ T cells, NK1.1+ and B220+ gated population shown in Fig. 1 at day 7 post transplant. Data generated from 2–3 independent experiments; error bars represent SEM
Fig. 7.
Fig. 7.
Transplantation of 3- and 10-week BCG infected GFP liver tissue under the kidney capsule of colorless recipient mice. A, Experimental Scheme. Briefly, Liver specimen (~0.15±3 mg) containing granulomas from a 3-, 6- or 10-week dsRED BCG infected GFP donor mouse is transplanted underneath the kidney capsule of colorless wildtype or Rag–/– recipients. B, To track cellular migration out of transplanted granulomas, frozen sections from cLN, rLN and spleen 7 days post transplant were analyzed by fluorescent microscopy images. C, Sections after transplant of a 6-week infected donor were stained for CD4 cells (red). Upper images taken at ×1000, lower images digitally zoomed in of region indicated by white box. Far right images of spleen demonstrate CD4+GFP+ co-staining, while middle and far left images do not. rLN sections from 3-week infected donor were stained with CD8 (red). Images taken at ×1000 and digitally magnified. Far right image, solid white arrow points to GFP+CD8– and dashed arrow points to GFP+CD8+ cell. Middle and right images, yellow arrows point to synpase-like co-staining of GFP+CD8– and CD8+ cell. D, draining rLN 2 weeks after 3-week infected GFP donor liver piece was transplanted into Rag–/– recipient. Images taken at ×10 and ×40, respectively

References

    1. Ulrichs T, Kaufmann SH. New insights into the function of granulomas in human tuberculosis. J Pathol. 2006 Jan;208(2):261–269. - PubMed
    1. Co DO, Hogan LH, Kim SI, Sandor M. Mycobacterial granulomas: keys to a long-lasting host-pathogen relationship. Clin Immunol. 2004 Nov;113(2):130–136. - PubMed
    1. Flynn JL, Chan J, Triebold KJ, Dalton DK, Stewart TA, Bloom BR. An essential role for interferon gamma in resistance to Mycobacterium tuberculosis infection. J Exp Med. 1993 Dec 1;178(6):2249–2254. - PMC - PubMed
    1. Volkman HE, Clay H, Beery D, Chang JC, Sherman DR, Ramakrishnan L. Tuberculous granuloma formation is enhanced by a mycobacterium virulence determinant. PLoS Biol. 2004 Nov;2(11):e367. - PMC - PubMed
    1. Schreiber HA, Hulseberg PD, Lee J, Prechl J, Barta P, Szlavik N, Harding JS, Fabry Z, Sandor M. Dendritic cells in chronic mycobacterial granulomas restrict local anti-bacterial T cell response in a murine model. PLoS One. 2010 Jul 6;5(7):e11453. doi: 10.1371/journal.pone.0011453. - DOI - PMC - PubMed

LinkOut - more resources