. 2011 Nov 16;101(10):2445-54.
doi: 10.1016/j.bpj.2011.10.007. Epub 2011 Nov 15.

Millisecond-scale biochemical response to change in strain

Affiliations

Millisecond-scale biochemical response to change in strain

Dale C Bickham et al. Biophys J. .

Abstract

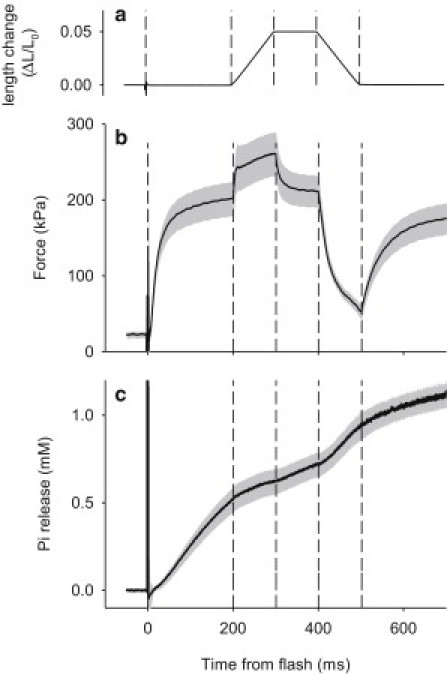
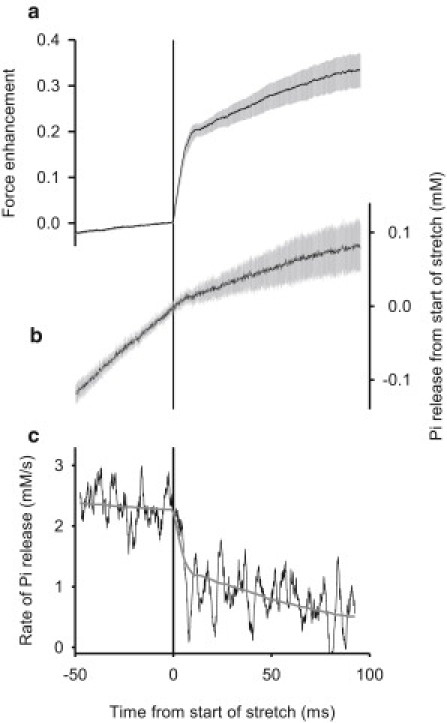
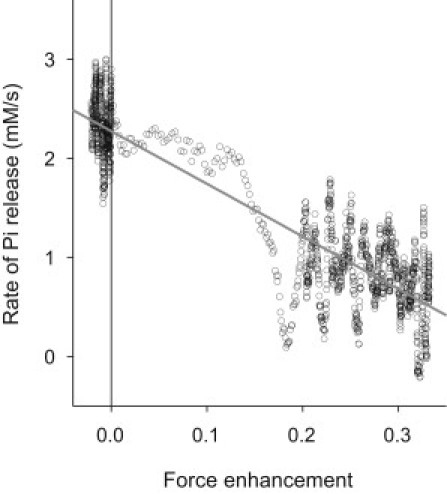
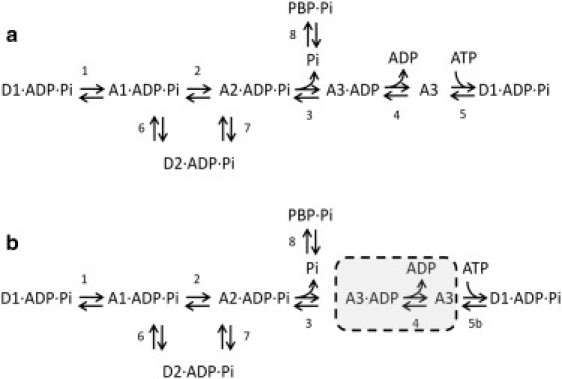
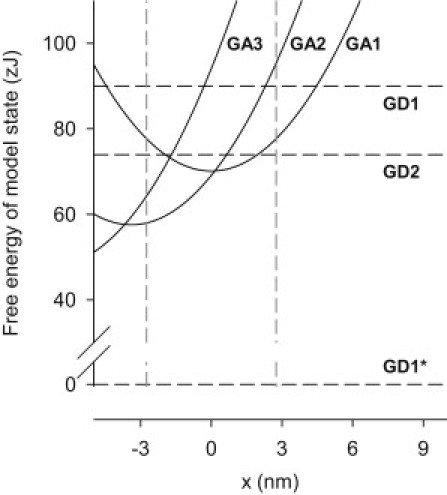
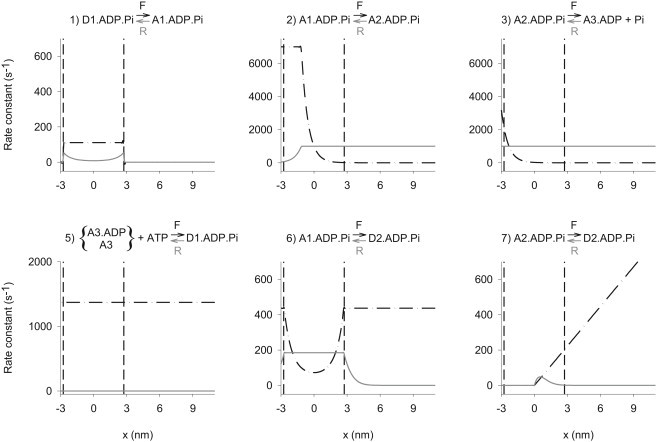
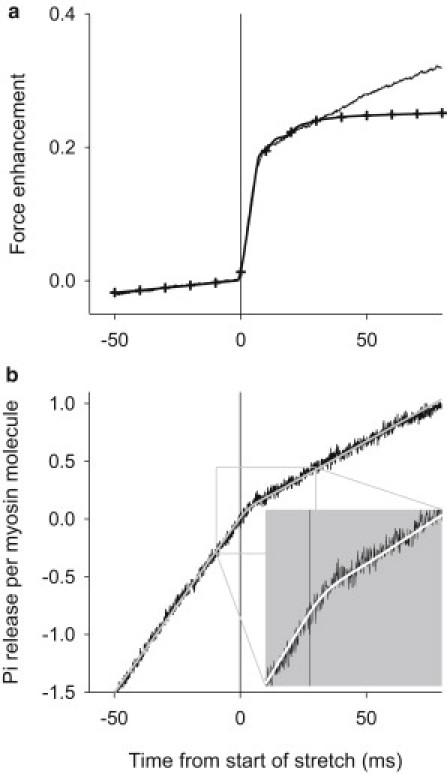
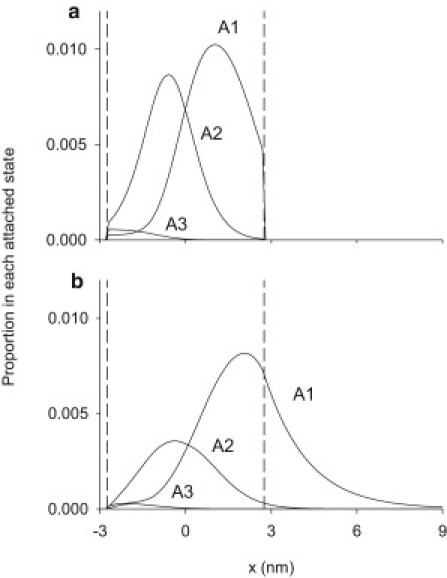
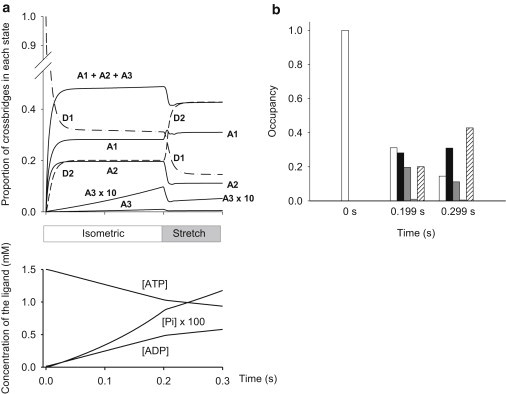
Muscle fiber contraction involves the cyclical interaction of myosin cross-bridges with actin filaments, linked to hydrolysis of ATP that provides the required energy. We show here the relationship between cross-bridge states, force generation, and Pi release during ramp stretches of active mammalian skeletal muscle fibers at 20°C. The results show that force and Pi release respond quickly to the application of stretch: force rises rapidly, whereas the rate of Pi release decreases abruptly and remains low for the duration of the stretch. These measurements show that biochemical change on the millisecond timescale accompanies the mechanical and structural responses in active muscle fibers. A cross-bridge model is used to simulate the effect of stretch on the distribution of actomyosin cross-bridges, force, and Pi release, with explicit inclusion of ATP, ADP, and Pi in the biochemical states and length-dependence of transitions. In the simulation, stretch causes rapid detachment and reattachment of cross-bridges without release of Pi or ATP hydrolysis.


Figures

Figure 1
Figure 1
Illustration of the experimental protocol. (a) Length change. (b) Force. (c) Pi release. Panels b and c show mean (line) ±1 (mean ± SE) (shading) for 17 observation on 17 fiber preparations. (Dashed vertical lines) Marking time of: laser flash, the start of stretch, end of stretch, start of shortening, and end of shortening.
Figure 2
Figure 2
Fluorescence signal and Pi release from actomyosin. (a) Binding curve from control experiments (see text) showing the relationship between fluorescence change (expressed relative to maximum fluorescence change) and the amount of Pi added to a solution containing a known amount of the biosensor, PBP (added Pi expressed relative to amount of PBP). The different symbols are results from independent runs using different PBP samples. The line shows the binding curve calculated with an apparent dissociation constant (appKd) 15.8 μM, found by fitting to values in abscissa range 0.41–1.34 where the curvature is greatest and where appKd affects the fit strongly. (b) Shows the residual difference between the each experimental point in panel a used for fitting and the corresponding value from the fitted line. (c) Illustrates the relationship between PBP.Pi, free Pi, and total Pi (= PBP.Pi + free Pi) that was used for experiments on contracting fibers. The PBP.Pi value is derived directly from the biosensor fluorescence signal. Total Pi (PBP.Pi + free Pi = the amount of Pi released due to ATP hydrolysis by actomyosin) is evaluated from PBP.Pi, the amount of PBP added to the fiber (1.2 mM), and the binding curve in panel a. Free Pi is the difference: total Pi – PBP.Pi.
Figure 3
Figure 3
Force and Pi release. (a) Force enhancement. (b) Pi release. (c) Rate of Pi release before and during stretch. Time zero corresponds to the end of the isometric period and the start of constant velocity stretch. Force enhancement = (force at time t – force at time 0)/force at time 0. Mean results from 36 observations on 36 fiber preparations. Each experiment's contribution to the mean was weighted by a factor equal to the inverse of the residual variance of Pi release from the regression mean ± weighed SE = sample standard deviation/sqrt b, where b = (Σweighting factor) 2/Σ (weighting factor2). (c, noisy line) Rate of Pi release obtained by differentiating the relationship shown in b using a second-order Savitzky-Golay filter (34) with a window of 51 points (0.1-ms intervals). (Smooth line) Force enhancement record a multiplied by the slope of the regression line in Fig. 4 + the intercept of that line.
Figure 4
Figure 4
Relation between force enhancement and rate of Pi release. Points are the data (average for 36 fiber preparations) at 0.1-ms intervals for the period from 47 ms before to 92 ms after the start of stretch. (Solid line) The regression line for all points. Slope = −5.31 mM/s per unit of force enhancement, intercept = 2.27 mM/s.
Figure 5
Figure 5
Reaction schemes used for the modeling. D = myosin with both heads detached from actin, A = myosin with one head attached to actin. D1, D2, A1, etc., correspond to states with different bound ligands (ADP, Pi) and different free energy levels. PBP is the fluorescent biosensor, MDCC-PBP. Reactions are identified by numbers, 1–8. (a) Full reaction scheme. (b) Simplified scheme in which A3.ADP and A3 are always in rapid equilibrium and the equilibrium mixture is treated as a single state.
Figure 6
Figure 6
Free energy (G) of the cross-bridge states as a function of x. (Curved lines) Attached states: A1, A2, and A3. (Horizontal lines) Detached states: D1 (before a cycle), D1 (before next cycle), and D2. (Two vertical dashed lines) Boundaries of the permitted region within which cross bridges can form attachments (see text). The label x is filament sliding relative to the point at which isometric force produced by the A1 state is zero. Free energy units: zJ per molecule.
Figure 7
Figure 7
Rate constants for the model reactions as a function of x. Forward rate constants (dashed). Reverse rates (solid). Note that the process of attachment from D1 is a forward reaction, but that attachment from D2 is the reverse of reactions 6 and 7. (Two vertical dashed lines in each graph) Boundaries of the permitted region within which cross-bridges can form attachments. Note that although reactions 6 and 7 have nonzero reverse rate constants, the rates are zero for x > 2.75 nm because the concentration of D2 is zero at x > 2.75 nm. The label x is filament sliding relative to the point at which isometric force produced by the A1 state is zero.
Figure 8
Figure 8
Data compared to simulations. (a) Mean force results from Fig. 1 (solid line) and the simulation from the model (solid line with ticks). (b) Mean Pi release results from Fig. 1 (solid lines) and the simulation from the model (light-shaded line). (Inset) Magnifies the scales by two. Pi release is expressed relative to the myosin concentration. Time zero corresponds to the start of constant velocity stretch that continues for the period shown.
Figure 9
Figure 9
x-distribution of attached states during isometric and stretch phases of the simulated contraction. (a) Isometric phase just before stretch. (b) During stretch at 0.050 s after the start of stretch. (Two vertical dashed lines) Boundaries of the permitted region within which cross bridges can form attachments. The label x is filament sliding relative to the point at which isometric force produced by A1 is zero.
Figure 10
Figure 10
Occupancy of the states during a simulated contraction with stretch. (a) Results of the simulation of the contraction: isometric from 0 to 0.2 s, then stretch until 0.3 s. (Upper graph) Time course of the occupancy of each state as a proportion of the total cross-bridge population. (Lower graph) Corresponding concentrations of ligands, ATP, ADP, and Pi. Note that these are free concentrations and that the values for Pi have been multiplied by 100 for visibility. (b) The figure picks three time-points in panel a, namely before contraction (t = 0 s), at the end of the isometric period (t = 0.199 s), and during stretch (t = 0.299 s) to show how state occupancy differs. Open bars: D1; black bars: A1; dark gray bars: A2; light gray bars: A3; hatched bars: D2.

References

    1. Pringle J.W. The Croonian Lecture, 1977. Stretch activation of muscle: function and mechanism. Proc. R. Soc. Lond. B Biol. Sci. 1978;201:107–130. - PubMed
    1. Huxley A.F., Simmons R.M. Proposed mechanism of force generation in striated muscle. Nature. 1971;233:533–538. - PubMed
    1. Brunello E., Reconditi M., et al. Lombardi V. Skeletal muscle resists stretch by rapid binding of the second motor domain of myosin to actin. Proc. Natl. Acad. Sci. USA. 2007;104:20114–20119. - PMC - PubMed
    1. Katz B. The relation between force and speed in muscular contraction. J. Physiol. 1939;96:45–64. - PMC - PubMed
    1. Flitney F.W., Hirst D.G. Filament sliding and energy absorbed by the cross-bridge in active muscle subjected to cyclical length changes. J. Physiol. 1978;276:467–479. - PMC - PubMed

Publication types