. 2011 Nov 16;101(10):2535-44.
doi: 10.1016/j.bpj.2011.10.013. Epub 2011 Nov 15.

Subdiffraction-limit study of Kaede diffusion and spatial distribution in live Escherichia coli

Affiliations

Subdiffraction-limit study of Kaede diffusion and spatial distribution in live Escherichia coli

Somenath Bakshi et al. Biophys J. .

Abstract

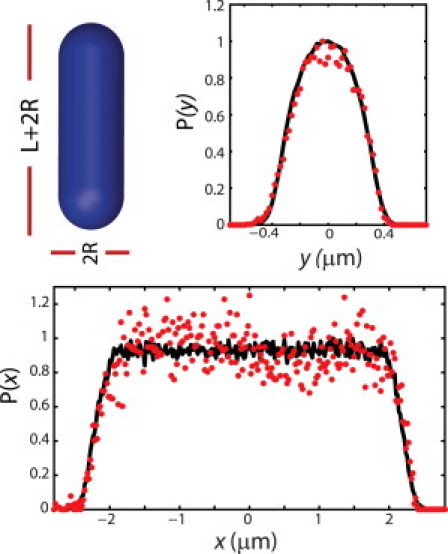
Photoactivation localization microscopy (PALM) is used to study the spatial distribution and diffusion of single copies of the protein Kaede in the cytoplasm of live Escherichia coli under moderate growth conditions (67 min doubling time). The spatial distribution of Kaede is uniform within the cytoplasm. The cytoplasmic radius of 380 ± 30 nm varies little from cell to cell. Single-particle tracking using 4 ms exposure times reveals negatively curved plots of mean-square displacement versus time. A detailed comparison with Monte Carlo simulations in a spherocylindrical volume shows that the curvature can be quantitatively understood in terms of free diffusion within a confining volume. The mean diffusion coefficient across cells is <D(Kaede)> = 7.3 ± 1.1 μm(2)·s(-1), consistent with a homotetrameric form of Kaede. The distribution of squared displacements along the long axis for individual Kaede molecules is consistent with homogeneous diffusion. However, for longer cells, a spatial map of one-step estimates of the diffusion coefficient along x suggests that diffusion is ∼20-40% faster within nucleoids than in the ribosome-rich region lying between nucleoid lobes at the cell mid-plane. Fluorescence recovery after photobleaching yielded <D(FRAP)> = 8.3 ± 1.6 μm(2)·s(-1), in agreement with the single-particle tracking results.


Figures

Figure 1
Figure 1
MSD versus time lag τ for the coordinates x (axial dimension), y (transverse dimension), and r=x2+y2 as shown. Data include 160 trajectories of 15 steps from a single cell. Error bars are ±1 SD of the mean values. Solid lines are the least-squares fits to the equation MSDi(τ)=Ai(1exp(τ/Ti)). The dotted line is a linear fit to the first three points of MSDx. Inset: Spatial distribution of all the single molecules from this cell.
Figure 2
Figure 2
Comparison of experimental MSD plots from Fig. 1 (circles) with those from Monte Carlo simulations of free diffusion in a spherocylinder of cylinder length L = 3.950 μm and radius R = 400 nm. Dimensions were chosen to match the spatial distribution of Kaede molecules in the cell of Fig. 1. Solid points are MSD along x and y from Fig. 1; error bars show 1 SD of the mean value. Swaths show the spread of MSD values (±1 SD of the mean) for 200 Monte Carlo runs using D = 6.8 μm2·s−1 (below data) and 8.4 μm2·s−1 (above data). Inset: Comparison of the first four experimental data for MSDx and MSDy with the spread of MSD values from the Monte Carlo simulations using D = 7.6 μm2·s−1 (gray swath).
Figure 3
Figure 3
(A) Sequence of FRAP images of Kaede for DH5α-strain cells grown in EZRDM. (B) Histograms of DSPT (DKaede from SPT) from 22 cells and DFRAP (DKaede from FRAP) from 23 cells.
Figure 4
Figure 4
Experimental distribution of Dx,j = <x2(τ)>j/2τ (three-step estimate of Dx for molecule j, taken from (solid bars) 13-step trajectories of 180 molecules in a single cell and (striped bars) 180 13-step trajectories from Monte Carlo simulations, with D = 7 μm2·s−1 chosen to match the experimental value for that cell. The solid curves show the smooth distribution of Dx,j obtained from 2000 Monte Carlo trajectories.
Figure 5
Figure 5
Moments of the scaling spectrum for moments 2–10 obtained from 160 15-step Kaede trajectories from a single cell. The linear least-squares fit (solid line) gives a slope of 0.46. See Fig. S6 for input data.
Figure 6
Figure 6
(A) Wide-field image of ribosomes in three cells labeled by S2-eYFP construct. (B) Wide-field image of chromosomal DNA in the same cells labeled by DRAQ5. (C) Overlay of the ribosome and DRAQ5 images, showing strong ribosome-nucleoid segregation. (D) 2D Kaede diffusion map in a different cell, with <Dx(x,y)> plotted as a false color map with scale as shown (see text). (E) 1D Kaede diffusion map <Dx(x,y)>y obtained as the weighted average of the 2D map over all y-values at each x.
Figure 7
Figure 7
Experimental distribution of Kaede positions (circles) along x and y, as obtained in a single cell by PALM using a 1.3 NA objective. Black lines are simulated projections along x and y for a homogeneously filled spherocylinder whose dimensions L and R were chosen to match experiment. See Fig. S2 for a comparison with results obtained with a 1.49 NA objective.

References

    1. Betzig E., Patterson G.H., et al. Hess H.F. Imaging intracellular fluorescent proteins at nanometer resolution. Science. 2006;313:1642–1645. - PubMed
    1. Hess S.T., Girirajan T.P.K., Mason M.D. Ultra-high resolution imaging by fluorescence photoactivation localization microscopy. Biophys. J. 2006;91:4258–4272. - PMC - PubMed
    1. Rust M.J., Bates M., Zhuang X.W. Sub-diffraction-limit imaging by stochastic optical reconstruction microscopy (STORM) Nat. Methods. 2006;3:793–795. - PMC - PubMed
    1. Manley S., Gillette J.M., et al. Lippincott-Schwartz J. High-density mapping of single-molecule trajectories with photoactivated localization microscopy. Nat. Methods. 2008;5:155–157. - PubMed
    1. Niu L., Yu J. Investigating intracellular dynamics of FtsZ cytoskeleton with photoactivation single-molecule tracking. Biophys. J. 2008;95:2009–2016. - PMC - PubMed

Publication types

MeSH terms

Substances

LinkOut - more resources