. 2011 Nov;17(11):2026-34.
doi: 10.3201/eid1711.110170.

Dynamics of cholera outbreaks in Great Lakes region of Africa, 1978-2008

Affiliations

Dynamics of cholera outbreaks in Great Lakes region of Africa, 1978-2008

Didier Bompangue Nkoko et al. Emerg Infect Dis. 2011 Nov.

Abstract

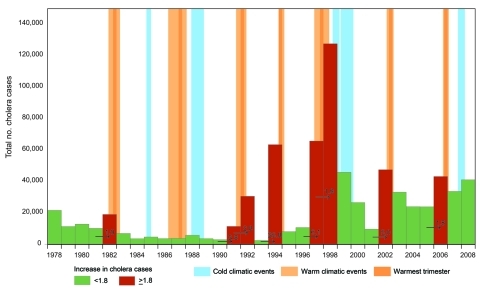
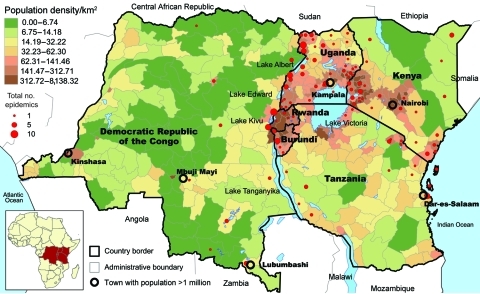
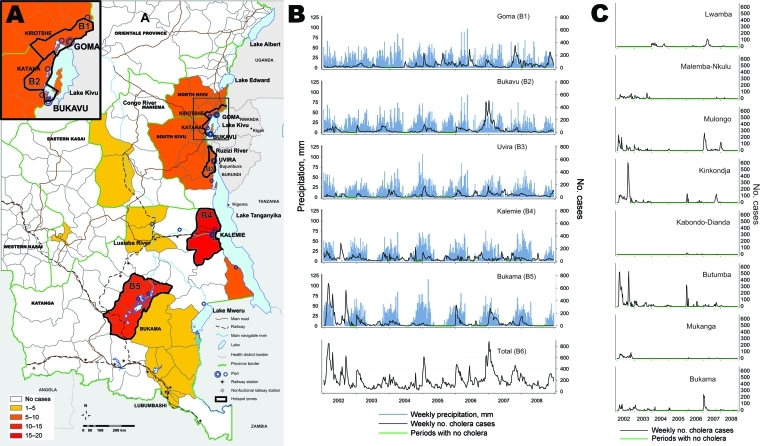
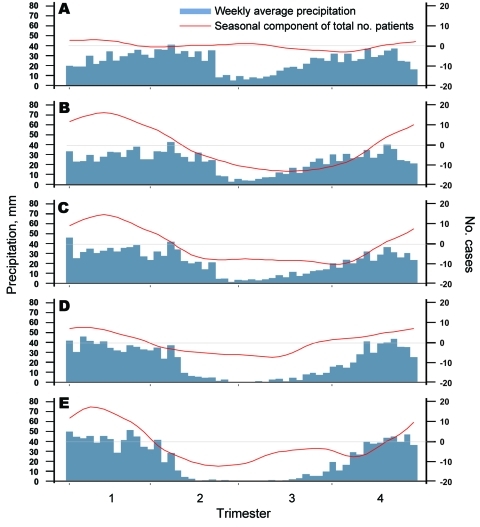
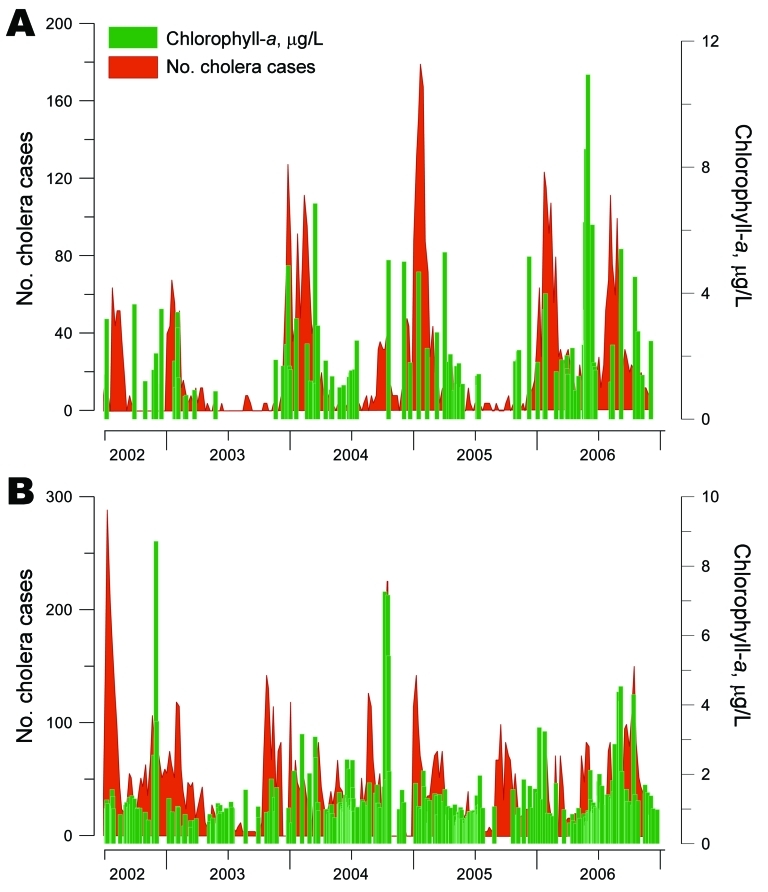
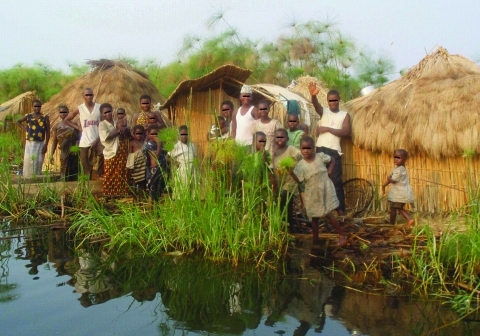
Cholera outbreaks have occurred in Burundi, Rwanda, Democratic Republic of Congo, Tanzania, Uganda, and Kenya almost every year since 1977-1978, when the disease emerged in these countries. We used a multiscale, geographic information system-based approach to assess the link between cholera outbreaks, climate, and environmental variables. We performed time-series analyses and field investigations in the main affected areas. Results showed that cholera greatly increased during El Nino warm events (abnormally warm El Ninos) but decreased or remained stable between these events. Most epidemics occurred in a few hotspots in lakeside areas, where the weekly incidence of cholera varied by season, rainfall, fluctuations of plankton, and fishing activities. During lull periods, persistence of cholera was explained by outbreak dynamics, which suggested a metapopulation pattern, and by endemic foci around the lakes. These links between cholera outbreaks, climate, and lake environments need additional, multidisciplinary study.


Figures

Figure 1
Figure 1
Yearly number of cholera cases in the African Great Lakes region (Burundi, Democratic Republic of Congo, Kenya, Rwanda, Tanzania, and Uganda), 1978–2008. Red bars indicate years with large increases in cholera cases. Numbers on arrows represent the increase factor in cholera cases. Warm climatic events (indicated by light orange background) had a duration of >5 months and a sea surface temperature increase of >0.5°C simultaneously in Niño 3 (eastern Pacific, from 90°W–150°W and 5°S–5°N) and Niño 4 (western Pacific, from 160°E–150°W and 5°S–5°N) regions.
Figure 2
Figure 2
Number of reports and localization of cholera outbreaks in the African Great Lakes region, 1999–2008, as reported by ProMED (11).
Figure 3
Figure 3
Temporal-spatial evolution of cholera cases in 5 hotspots in the African Great Lakes region, 2002–2008. A) Spatial distribution of cholera in the provinces of Katanga, North Kivu, and South Kivu (Democratic Republic of Congo). Health districts are colored according to the risk ratio of the cluster, as calculated by using SatSCan software (Kulldorf, Cambridge, UK). B) Evolution of the weekly number of cholera cases in the 5 hotspots (B1–B5). B1) Goma and Kirotshe health districts; B2) Bukavu and Katana health districts; B3) Uvira health district; B4) Kalemie and Nyemba health districts; B5) 8 health districts in the Upper Congo River Basin (see district names in panel C); B6) total cases for the 5 hotspots. Green indicates periods without cholera; blue indicates estimated weekly rainfalls. The global curve did not show any remission periods. C) Evolution of the weekly number of cholera cases in the 8 health districts composing the Upper Congo Basin hotspot. The epidemic curve in B5 was composed of partially synchronous epidemics separated by periods of lull.
Figure 4
Figure 4
Seasonal patterns/components of cholera outbreaks for 5 hotspots in the African Great Lakes region, 2002–2008. Hotspots are Goma (A), Bukavu (B), Uvira (C), Kalemie (D), and Upper Congo Basin (E). Blue indicates the weekly average precipitation (in mm); red indicates the seasonal component of the total number of patients after the time series was decomposed into a trend and seasonal and residual components by using a seasonal-trend decomposition procedure based on loess regression. Horizontal gray lines indicate seasonal component = 0.
Figure 5
Figure 5
Link between the number of cholera cases and fluctuations in phytoplankton abundance (chlorophyll-a concentrations) in Lake Tanganyika, Africa Great Lakes region, January 2002–December 2006. Two of 5 cholera hotspots in the region were tested, both of which face Lake Tanganyika: Uvira (A) and Kalemie (B). Green indicates median concentrations of chlorophyll-a in surface water; red indicates cholera cases.
Figure 6
Figure 6
Fishing camp on an island in Lake Upemba, upper Congo River Basin. Fishermen and their families usually spend several weeks every year in camps like this, in which the lake is the only source of water. Because there is no firewood in such areas, campaigns promoting the boiling of water are useless. (Photograph by Didier Bompangue.)

References

    1. Constantin de Magny G, Colwell R. Cholera and climate: a demonstrated relationship. Trans Am Clin Climatol Assoc. 2009;120:119–28. - PMC - PubMed
    1. Alam M, Sultana M, Nair G, Siddique A, Hasan N, Sack R, et al. Viable but nonculturable Vibrio cholerae O1 in biofilms in the aquatic environment and their role in cholera transmission. Proc Natl Acad Sci U S A. 2007;104:17801–6. 10.1073/pnas.0705599104 - DOI - PMC - PubMed
    1. Hashizume M, Faruque A, Wagatsuma Y, Hayashi T, Armstrong B. Cholera in Bangladesh: climatic components of seasonal variation. Epidemiology. 2010;21:706–10. 10.1097/EDE.0b013e3181e5b053 - DOI - PubMed
    1. Ohtomo K, Kobayashi N, Sumi A, Ohtomo N. Relationship of cholera incidence to El Niño and solar activity elucidated by time-series analysis. Epidemiol Infect. 2010;138:99–107. 10.1017/S0950268809990203 - DOI - PubMed
    1. Colwell RR. Global climate and infectious disease: the cholera paradigm. Science. 1996;274:2025–31. 10.1126/science.274.5295.2025 - DOI - PubMed

Publication types

LinkOut - more resources