

Laterality defects are influenced by timing of treatments and animal model
- PMID: 22099174
- PMCID: PMC3222854
- DOI: 10.1016/j.diff.2011.08.004
Laterality defects are influenced by timing of treatments and animal model
Abstract
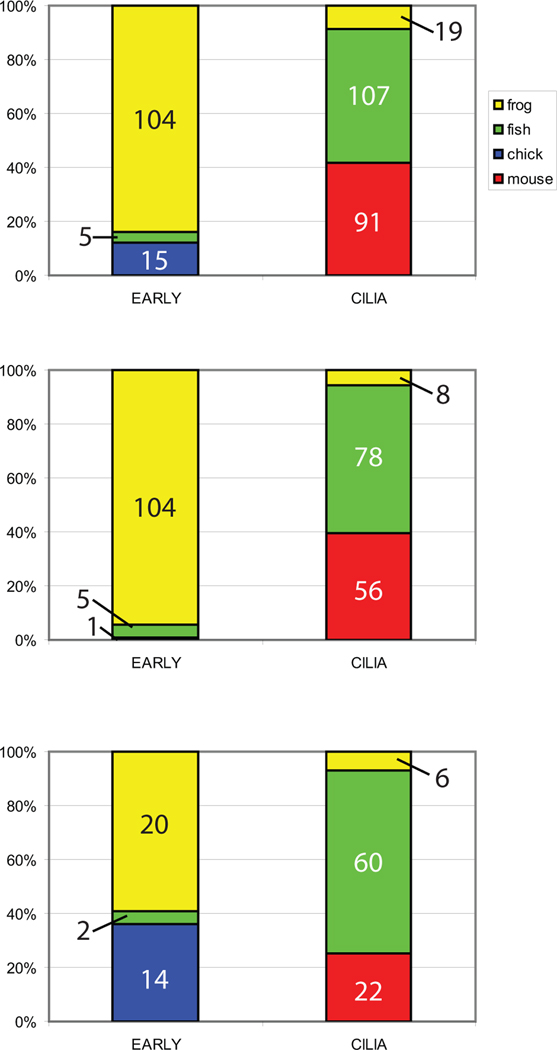
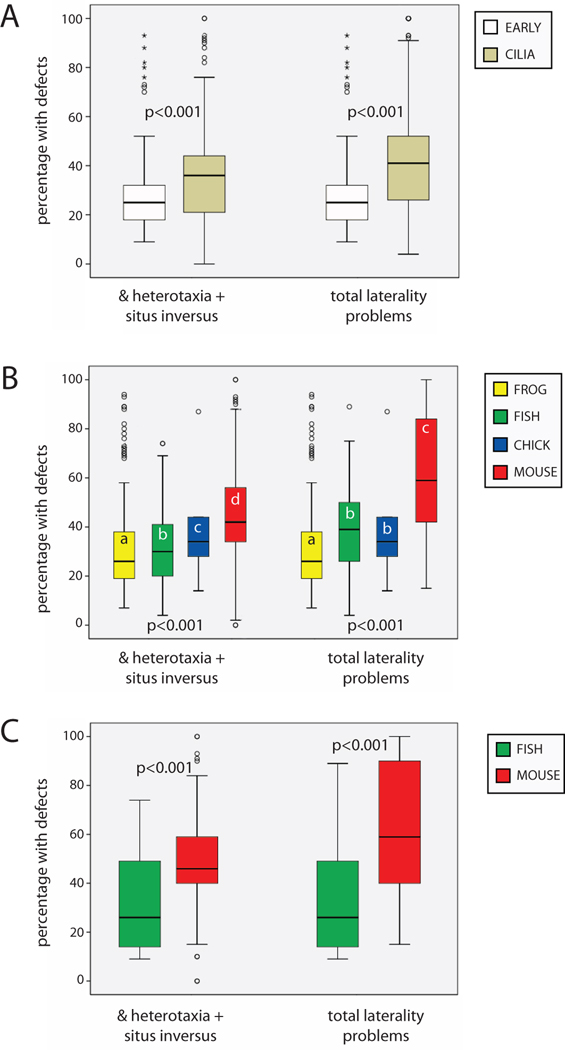
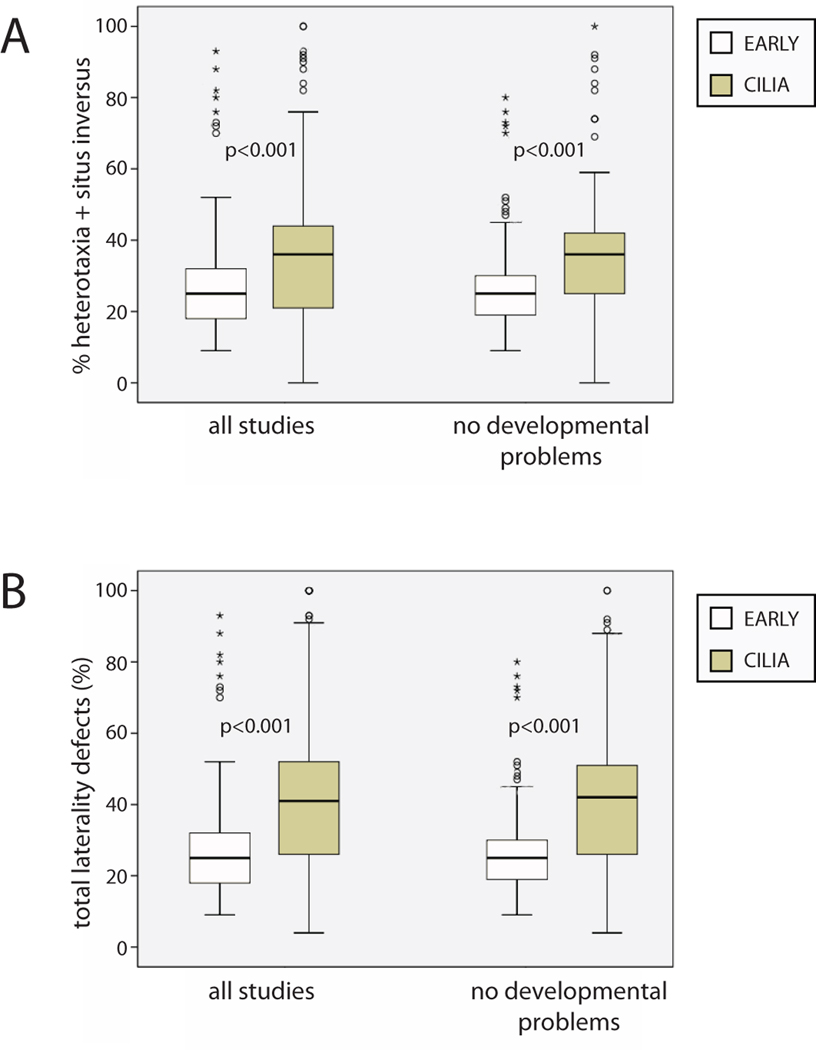
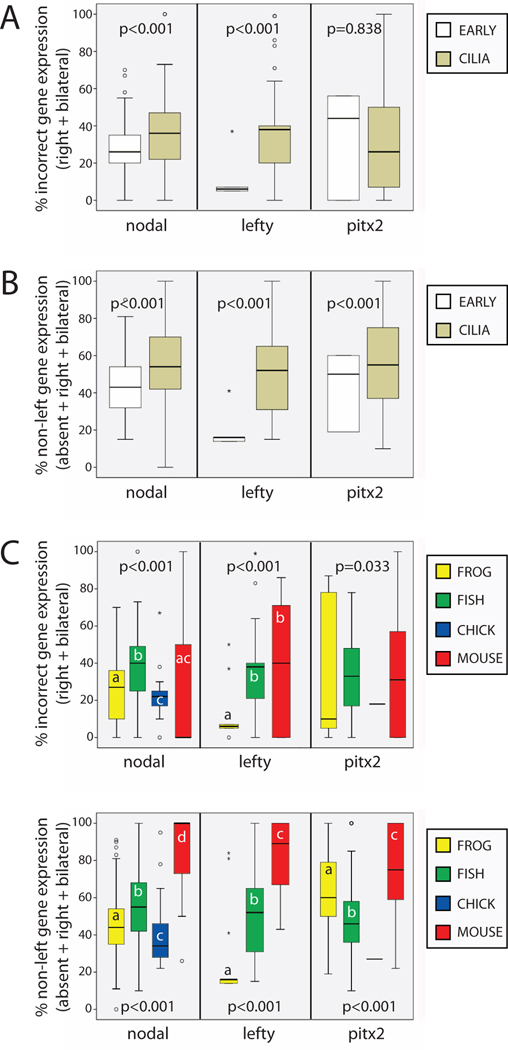
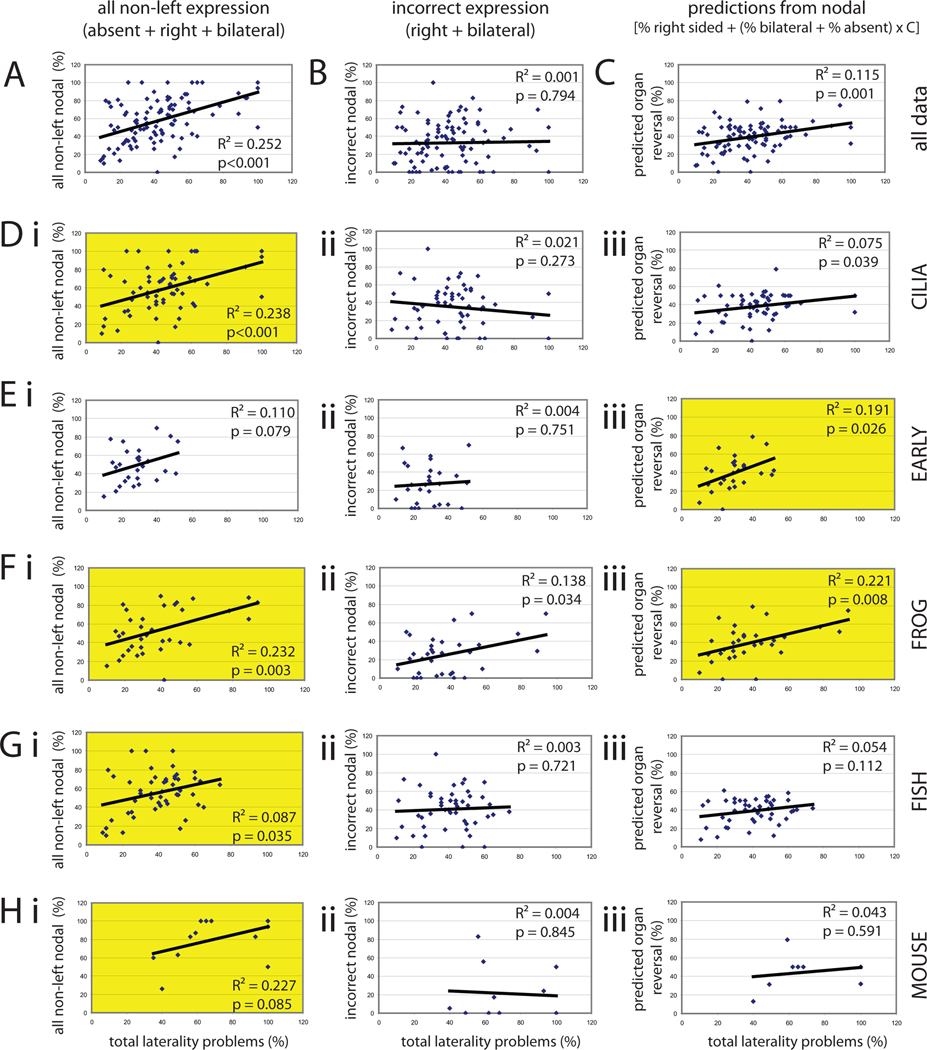
The timing of when the embryonic left-right (LR) axis is first established and the mechanisms driving this process are subjects of strong debate. While groups have focused on the role of cilia in establishing the LR axis during gastrula and neurula stages, many animals appear to orient the LR axis prior to the appearance of, or without the benefit of, motile cilia. Because of the large amount of data available in the published literature and the similarities in the type of data collected across laboratories, I have examined relationships between the studies that do and do not implicate cilia, the choice of animal model, the kinds of LR patterning defects observed, and the penetrance of LR phenotypes. I found that treatments affecting cilia structure and motility had a higher penetrance for both altered gene expression and improper organ placement compared to treatments that affect processes in early cleavage stage embryos. I also found differences in penetrance that could be attributed to the animal models used; the mouse is highly prone to LR randomization. Additionally, the data were examined to address whether gene expression can be used to predict randomized organ placement. Using regression analysis, gene expression was found to be predictive of organ placement in frogs, but much less so in the other animals examined. Together, these results challenge previous ideas about the conservation of LR mechanisms, with the mouse model being significantly different from fish, frogs, and chick in almost every aspect examined. Additionally, this analysis indicates that there may be missing pieces in the molecular pathways that dictate how genetic information becomes organ positional information in vertebrates; these gaps will be important for future studies to identify, as LR asymmetry is not only a fundamentally fascinating aspect of development but also of considerable biomedical importance.
Copyright © 2011 International Society of Differentiation. Published by Elsevier B.V. All rights reserved.
Figures
Similar articles
-
A unified model for left-right asymmetry? Comparison and synthesis of molecular models of embryonic laterality.Dev Biol. 2013 Jul 1;379(1):1-15. doi: 10.1016/j.ydbio.2013.03.021. Epub 2013 Apr 10. Dev Biol. 2013. PMID: 23583583 Free PMC article. Review.
-
Serotonin has early, cilia-independent roles in Xenopus left-right patterning.Dis Model Mech. 2013 Jan;6(1):261-8. doi: 10.1242/dmm.010256. Epub 2012 Aug 16. Dis Model Mech. 2013. PMID: 22899856 Free PMC article.
-
CACNA1G, A Heterotaxy Candidate Gene, Plays a Role in Ciliogenesis and Left-Right Patterning in Xenopus tropicalis.Genesis. 2025 Feb;63(1):e70009. doi: 10.1002/dvg.70009. Genesis. 2025. PMID: 40008628
-
Linking early determinants and cilia-driven leftward flow in left-right axis specification of Xenopus laevis: a theoretical approach.Differentiation. 2012 Feb;83(2):S67-77. doi: 10.1016/j.diff.2011.11.005. Epub 2011 Dec 1. Differentiation. 2012. PMID: 22136958 Review.
-
Polarity proteins are required for left-right axis orientation and twin-twin instruction.Genesis. 2012 Mar;50(3):219-34. doi: 10.1002/dvg.20825. Epub 2011 Dec 27. Genesis. 2012. PMID: 22086838 Free PMC article.
Cited by
-
It's never too early to get it Right: A conserved role for the cytoskeleton in left-right asymmetry.Commun Integr Biol. 2013 Nov 1;6(6):e27155. doi: 10.4161/cib.27155. Epub 2013 Nov 14. Commun Integr Biol. 2013. PMID: 24505508 Free PMC article.
-
HCN4 ion channel function is required for early events that regulate anatomical left-right patterning in a nodal and lefty asymmetric gene expression-independent manner.Biol Open. 2017 Oct 15;6(10):1445-1457. doi: 10.1242/bio.025957. Biol Open. 2017. PMID: 28818840 Free PMC article.
-
A unified model for left-right asymmetry? Comparison and synthesis of molecular models of embryonic laterality.Dev Biol. 2013 Jul 1;379(1):1-15. doi: 10.1016/j.ydbio.2013.03.021. Epub 2013 Apr 10. Dev Biol. 2013. PMID: 23583583 Free PMC article. Review.
-
Serotonin has early, cilia-independent roles in Xenopus left-right patterning.Dis Model Mech. 2013 Jan;6(1):261-8. doi: 10.1242/dmm.010256. Epub 2012 Aug 16. Dis Model Mech. 2013. PMID: 22899856 Free PMC article.
-
Symmetry breakage in the vertebrate embryo: when does it happen and how does it work?Dev Biol. 2014 Sep 1;393(1):109-23. doi: 10.1016/j.ydbio.2014.06.014. Epub 2014 Jun 24. Dev Biol. 2014. PMID: 24972089 Free PMC article. Review.
References
-
- Amack JD, Wang X, Yost HJ. Two T-box genes play independent and cooperative roles to regulate morphogenesis of ciliated Kupffer's vesicle in zebrafish. Dev Biol. 2007;310:196–210. - PubMed
-
- Armakolas A, Klar AJ. Left-right dynein motor implicated in selective chromatid segregation in mouse cells. Science. 2007;315:100–101. - PubMed
Publication types
MeSH terms
Substances
Grants and funding
LinkOut - more resources
Full Text Sources
