. 2011 Nov 18;44(4):532-44.
doi: 10.1016/j.molcel.2011.08.045.

Fine-tuning of Drp1/Fis1 availability by AKAP121/Siah2 regulates mitochondrial adaptation to hypoxia

Affiliations

Fine-tuning of Drp1/Fis1 availability by AKAP121/Siah2 regulates mitochondrial adaptation to hypoxia

Hyungsoo Kim et al. Mol Cell. .

Abstract

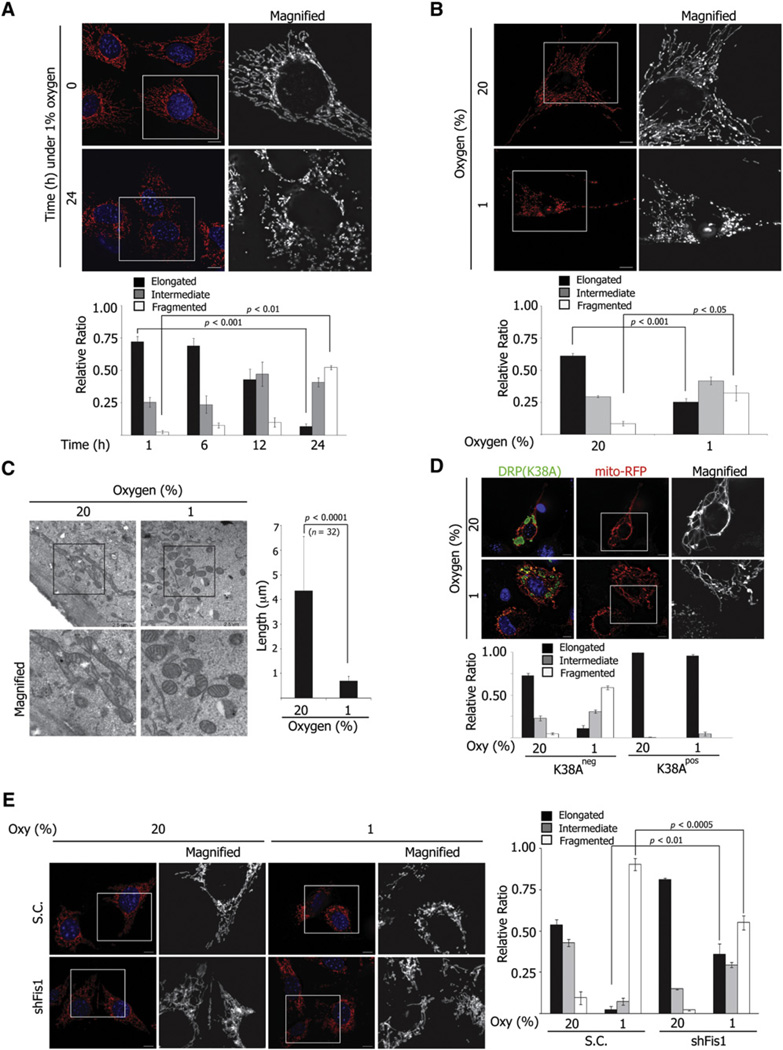
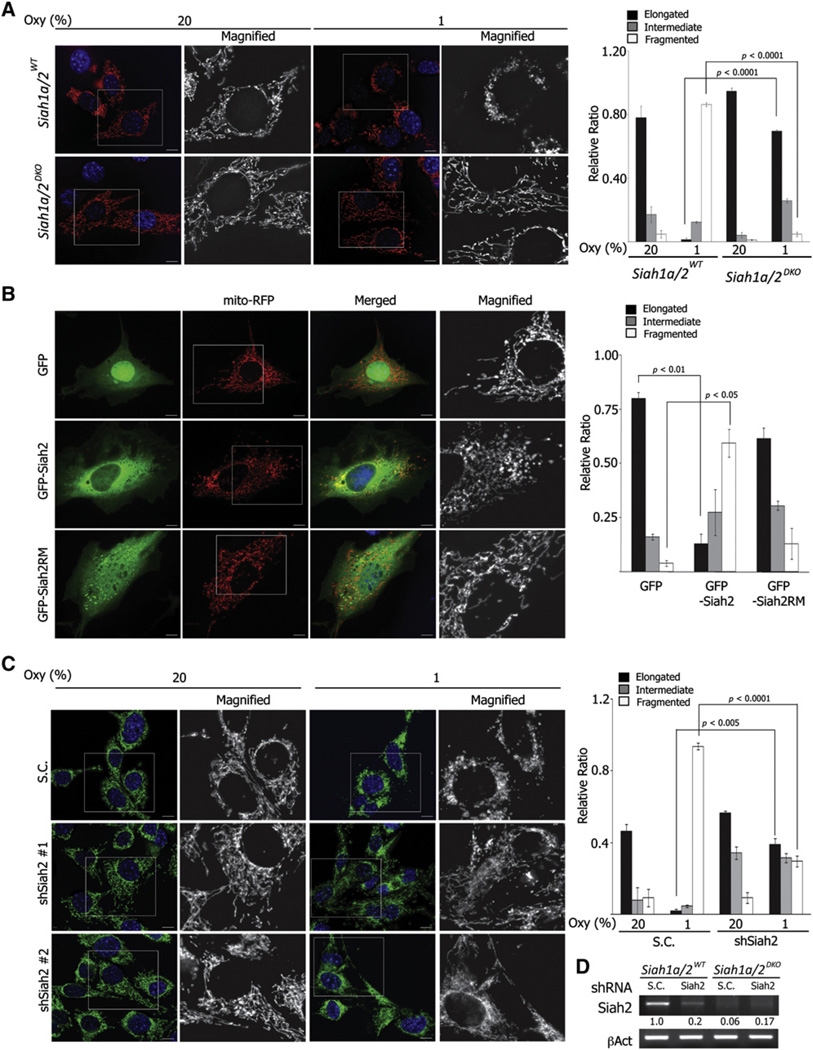
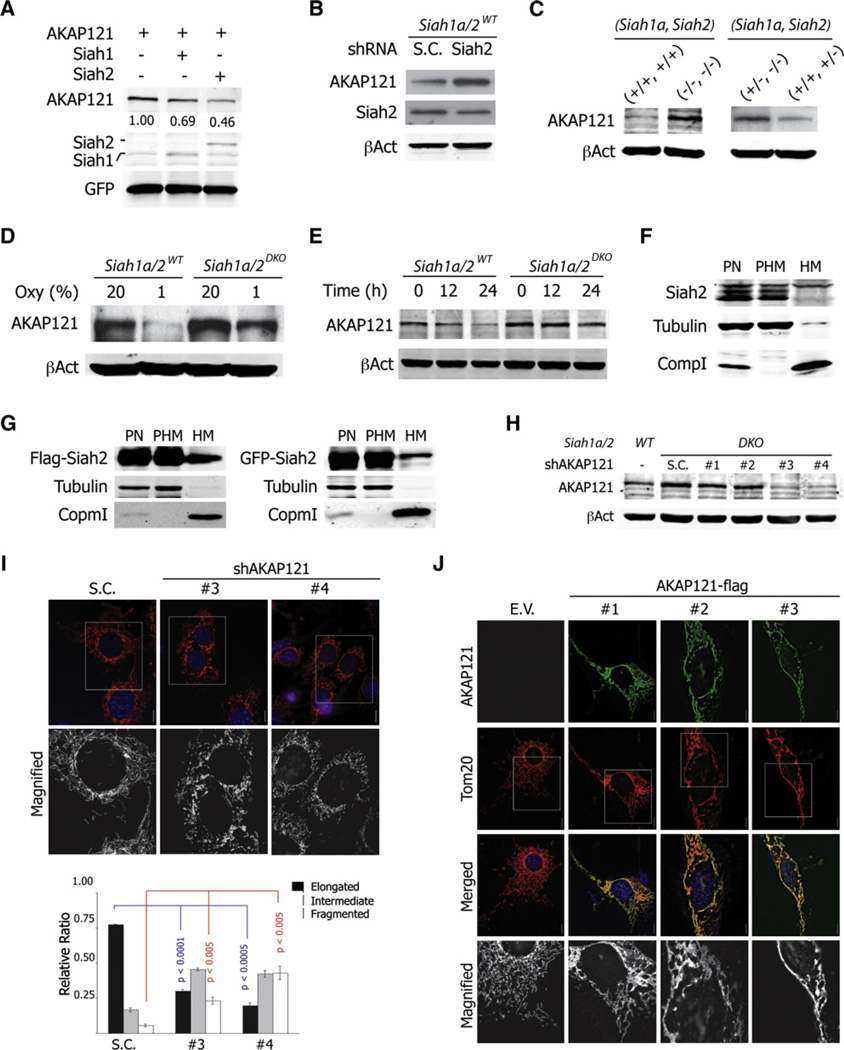
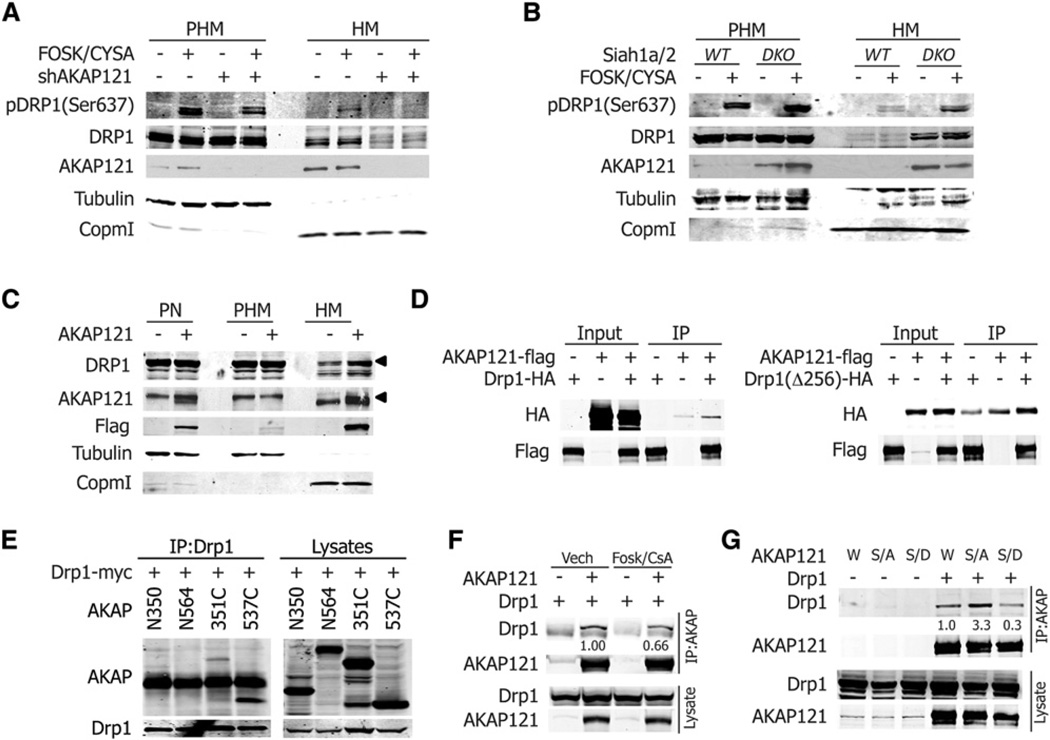
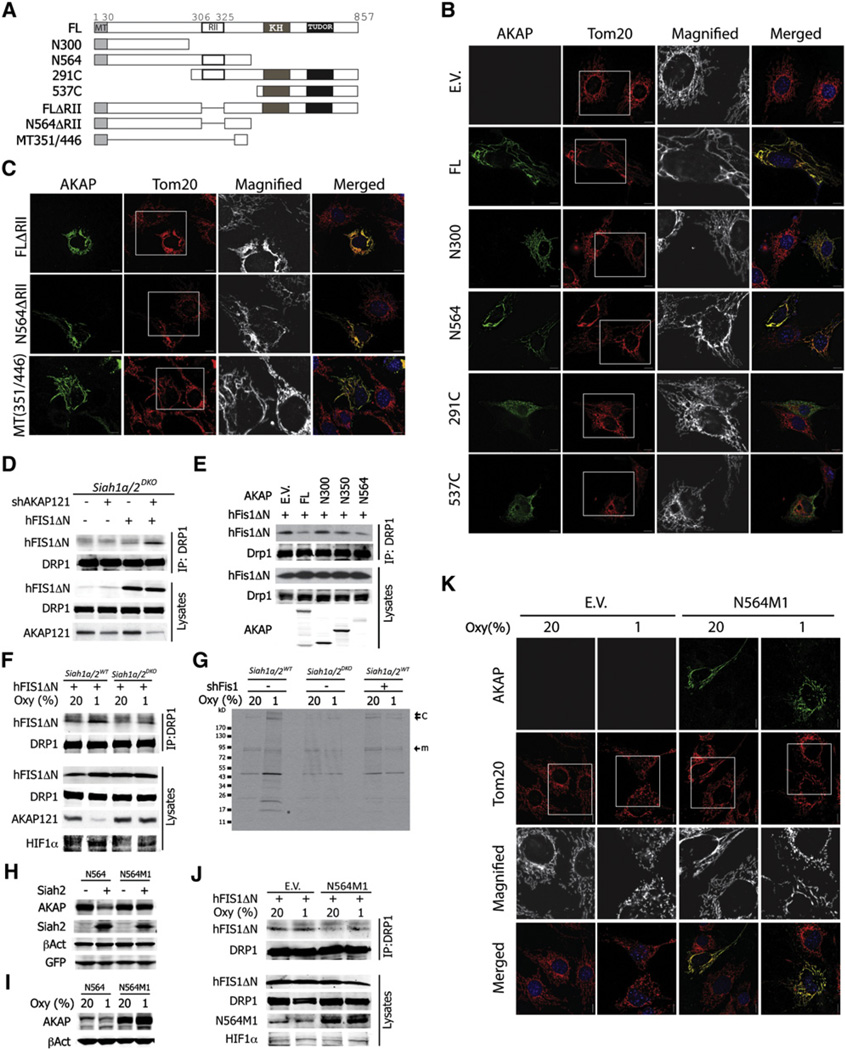
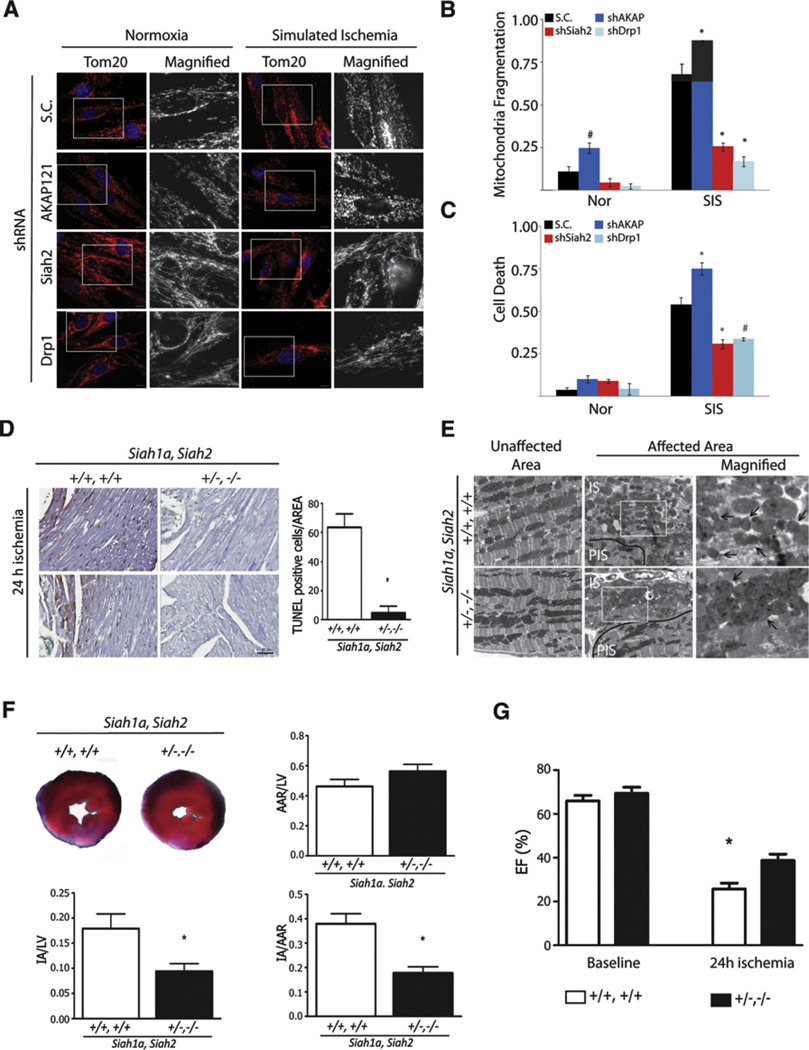
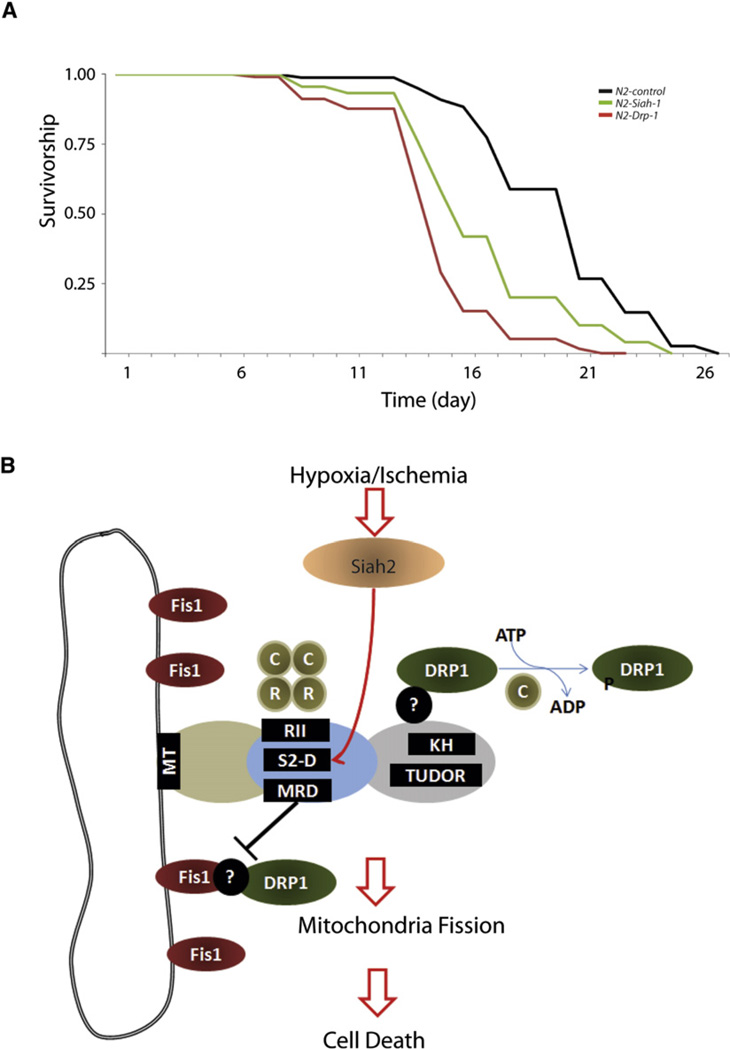
Defining the mechanisms underlying the control of mitochondrial fusion and fission is critical to understanding cellular adaptation to diverse physiological conditions. Here we demonstrate that hypoxia induces fission of mitochondrial membranes, dependent on availability of the mitochondrial scaffolding protein AKAP121. AKAP121 controls mitochondria dynamics through PKA-dependent inhibitory phosphorylation of Drp1 and PKA-independent inhibition of Drp1-Fis1 interaction. Reduced availability of AKAP121 by the ubiquitin ligase Siah2 relieves Drp1 inhibition by PKA and increases its interaction with Fis1, resulting in mitochondrial fission. High AKAP121 levels, seen in cells lacking Siah2, attenuate fission and reduce apoptosis of cardiomyocytes under simulated ischemia. Infarct size and degree of cell death were reduced in Siah2(-/-) mice subjected to myocardial infarction. Inhibition of Siah2 or Drp1 in hatching C. elegans reduces their life span. Through modulating Fis1/Drp1 complex availability, our studies identify Siah2 as a key regulator of hypoxia-induced mitochondrial fission and its physiological significance in ischemic injury and nematode life span.


Figures

Figure 1
Figure 1. Hypoxia Induces Mitochondria Fission
(A) NIH 3T3 cells were cultured under hypoxia for the indicated times and visualized with anti-Tom20 antibody. Mitochondria morphology was assessed from 300 cells of three different slides at each time point and quantified (see Figure S1A). (B) BJ cells expressing mito-RFP were cultured under normoxia (upper) or hypoxia (lower) for 24 hr. (C) Ultrastructure of mitochondria in NIH 3T3 cells cultured under normoxia (20%) or hypoxia (1%). The length of mitochondria was measured from four different images (number of mitochondria counted, n = 32). Scale bars indicate 2.5 µm. (D) NIH 3T3 cells transduced with retroviral mito-RFP (red) were transfected by Drp1(K38A) (green) and cultured under the indicated oxygen concentration for 24 hr. Mitochondrial morphology was assessed and quantified from cells with positive or negative green (Drp1K38A) signal. (E) MEFs were transduced with scrambled or shFis1 lentivirus and cultured under normoxia or hypoxia for 24 hr. Mitochondria were visualized with anti-Tom20 antibody. For (A)–(E), data are presented as mean ± SD (standard deviation). Scale bars indicate 10 µm unless specified otherwise.
Figure 2
Figure 2. Hypoxia-Induced Mitochondrial Fission Is Impaired in the Absence of Siah Expression
(A) Siah1a/2WT and Siah1a/2DKO MEFs expressing mito-RFP were incubated for 24 hr under indicated oxygen concentrations. Mitochondria morphology was quantified from 300–600 cells from three different experiments. (B) NIH 3T3 cells expressing mito-RFP were transfected with GFP, GFP-Siah2WT, or GFP-Siah2RM. Mitochondria morphology from 200 cells with positive GFP was quantified. (C) Siah1a/2WT MEFs stably transduced with shSiah2 lentivirus were incubated under indicated oxygen conditions. Mitochondria were visualized with anti-Tom20 antibody and quantified. For (A)–(C), data are presented as mean ± SD. Scale bars indicate 10 µm. (D) The efficiency of Siah2 shRNA is shown through corresponding RT-PCR bands. The ratio of band intensity was quantified using NIH Image J software and normalized with corresponding β-actin bands.
Figure 3
Figure 3. AKAP121 Regulates Mitochondrial Morphology
(A) HEK293T cells were transfected with AKAP121-Flag, Flag-Siah1aWT, or Flag-Siah2WT, as indicated. Cell lysates were prepared and analyzed using indicated antibodies. GFP served as a control for equal transfection. Band intensity was quantified as indicated in Figure 2D. (B) Siah1a/2WT MEF cells were transduced with scrambled or shRNA against Siah2. (C) Cell lysates from immortalized (left) or primary (right) MEF cells with indicated genotypes were analyzed. (D and E) Cell lysates were prepared from Siah1a/2WT and Siah1a/2DKO MEFs incubated for 24 hr (D) or for the indicated time periods (E) at the indicated oxygen concentrations, followed by analysis using anti-AKAP121 antibody. (F) HEK293T cells were fractionated into postnucleus (PN), post-heavy membrane (PHM), and heavy membrane (HM) fractions as described in experimental procedures. Of each fraction, 20 µg was analyzed. β-tubulin and Complex1 (Comp1) served as markers for PHM and HM fractions, respectively. (G) HEK293T cells were transfected with Flag- or GFP-tagged Siah2 constructs, respectively. Cells were fractionated and analyzed as in (F). (H) The efficiency of four different AKAP121 shRNAs is monitored by immunoblotting of cell lysates obtained from transduced Siah1a/2DKO MEFs. (I) Mitochondria from control or AKAP121 knockdown Siah1a/2DKO MEFs were visualized by transducing mito-RFP viral particles and quantified. Data are presented as mean ± SD of three different slides. (J) NIH 3T3 cells were transfected with empty vector (E.V.) or Flag-AKAP121. Mitochondria were visualized with anti-Tom20 antibody. All scale bars indicate 10 µm.
Figure 4
Figure 4. AKAP121 Facilitates the Phosphorylation of Drp1 at Mitochondria Microenvironment
(A and B) Siah1a/2DKO and Siah1a/2DKO MEFs stably expressing scrambled or shRNA against AKAP121 (A) or Siah1a/2WT and Siah1a/2DKO MEFs (B) were stimulated with forskolin (10 µM) and cyclosporine (10 µM) for 30 min. Cells were fractionated as described in the Experimental Procedures. (C) HEK293T cells were transfected with AKAP121-Flag. Lysates from each fraction were analyzed with indicated antibodies. (D) HEK293T cells transfected with indicates constructs. Lysates were immunoprecipitated with Flag (AKAP121) and immuoblotted with HA (Drp1 or Drp1Δ256 [lacking GTPase domain]). (E) HEK293T cells transfected with Drp1-myc and indicated constructs of AKAP121, N350 (1–350), N564 (1–564), C351 (351–857), and C537 (537–857). Lysates were immunoprecipitated and blotted with indicated antibodies. (F) Cells were transfected with indicated constructs and treated with forskolin (10 µM)/cyclosporineA (10 µM) for 30 min. (G) Cells were transfected with AKAP121 and Drp1 wild-type (W), phosphormutant S637A(S/A), and phosphomimic mutant S637D (S/D). (F and G) Intensity of immunoprecipitated Drp1 bands was quantified by normalizing with corresponding input for Drp1. The values in the control groups were set to 1.
Figure 5
Figure 5. Central Domain of AKAP121 Inhibits Drp1-Fis1 Interaction
(A) Series of truncated constructs were generated as indicated. (B and C) NIH 3T3 cells were transfected with empty vector (E.V.) or indicated AKAP121 constructs. Mitochondria were visualized with anti-Tom20 (red) and AKAP121 with anti-Flag (green). (D) Siah1a/2DKO MEFs stably expressing control or shAKAP RNA were transfected with Fis1DN. Cell lysates were immunoprecipitated and immunoblotted with indicated antibodies. (E) Siah1a/2WT MEFs were transfected with Fis1ΔN and indicated AKAP121 constructs. Cell lysates were analyzed as in (D). (F) Siah1a/2WT and Siah1a/2DKO MEFs transfected with Fis1ΔN were grown for 24 hr under indicated oxygen concentrations. Lysates were analyzed as in (D). (G) MEFs with indicated genotypes were cultured, labeled, and crosslinked as described in the Experimental Procedures. Lysates were immunoprecipitated with anti-Drp1 antibody. “m” and “c” indicate the expected molecular weight of Drp1 monomer and oligomer or complex, respectively. The asterisk indicates expected band of Fis1 around 17 kD. (H) HEK293T cells were transfected with N564 and N564M1 constructs with or without Siah2. (I) NIH 3T3 cells transfected with N564M1 were grown under normoxia (20%) or hypoxia (1%) for 24 hr. (J) Siah1a/2WT MEFs transfected with Fis1ΔN and/or N564M1 were grown for 24 hr under indicated oxygen concentrations. (K) Siah1a/2WT MEFs transfected with empty vector (E.V.) or N564M1 were grown under indicated oxygen concentration for 24 hr. AKAP121 (FL or N564M1) and mitochondria were visualized with anti-Flag and anti-Tom20 antibodies, respectively. All scale bars indicate 10 µm.
Figure 6
Figure 6. Siah2 Controls Ischemia-Mediated Remodeling of Mitochondria Dynamics and Cell Death of Cardiomyocytes In Vitro and In Vivo
(A–C) H9C2 cells subjected to knockdown with scrambled (S.C.) or shRNA against indicated genes was incubated under normoxia or simulated ischemia for 6 hr. (A) The morphology of mitochondria was visualized with anti-Tom20 antibody and (B) quantified by counting cells (200–300 cells) with fragmented mitochondria in three independent experiments. Data are presented as mean ± SD (C) Cell death was assessed by propidium iodide staining. Death rate was quantified by counting the number of cells with PI-positive signal per total number of cells of ten different fields (100 cells) in three independent experiments. Data are presented as mean ± SD. The asterisks and fountains indicate p < 0.005 and p < 0.05, respectively. (D) Representative images of histological sections of left ventricular myocardium from Siah1aWT/2WT and Siah1aHT/2KO mice 24 hr after myocardial infarction (MI). The TUNEL-positive cells in the area are quantified on three consecutive images of the AAR (n = 2 or 3 animals per Siah1aWT/2WT or Siah1aHT/2KO, respectively). Data are represented as mean ± SD. Scale bar indicates 50 µm. (E) Ultrastructure of ventricular myocardium tissues from Siah1aWT/2WT and Siah1aHT/2KO mice exposed to 24 hr of myocardial infarction represent unaffected and affected areas. PIS and IS indicate peri-ischemic and ischemic regions, respectively. Scale bars indicate 5 µm. The arrows indicate mitochondria. (F) (Upper left) Representative images of slices of ventricular myocardium from Siah1aWT/2WT and Siah1aHT/2KO mice 24 hr after myocardial infarction. The ratio of area at risk (AAR) to LV (left ventricle) (upper right), ratio of IA (infract area) to LV (lower left), and ratio of IA to AAR (lower right) were quantified. (G) Ejection fraction percent (EF%) was calculated from echocardiographic images at 24 hr post-MI (see the Supplemental Experimental Procedures and the supplemental movies). Note the less impaired cardiac function of the double mutant Siah1aHT/Siah2KO relative to Siah1aWT/Siah2WT littermates post-MI. For (F) and (G), n = 3 animals per each genotype. Data are presented as mean ± SD. The asterisk indicates p < 0.05.
Figure 7
Figure 7. Depletion of siah-1 or drp-1 from Hatch Decreases the Life Span of C. elegans
(A) RNAi-mediated depletion of C. elegans drp-1 and siah-1 resulted in reduction of mean life span N2-control (black line, mean 20.1 ± 0.3 days), N2-drp-1 (red line, 15.5 ± 0.3 days), and N2-siah-1 (green line, 17.5 ± 0.4 days, log rank p < 0.0001 in each case). RNAi depletion was initiated from hatch. (B) A proposed model. AKAP121 regulates mitochondria dynamics through (1) facilitating Drp1 phosphorylation via PKA binding domain (RII) (2) providing a docking site for Drp1 at C-terminal domains and (3) via inhibition of Drp1-Fis1 interaction by mitochondria fission regulatory domain (MRD) within central region. Upon hypoxia or ischemia, Siah2 reduces availability of AKAP121 via Siah degron (SD), which decreases AKAP121-mediated Drp1 phosphorylation and increases Drp1-Fis1 interaction, resulting in mitochondria fission and cell death of cardiomyocytes under myocardial ischemia. Question marks indicate an unidentified component(s) that is expected to be involved in AKAP121-mediated regulation of Fis1-Drp1 complex.

References

    1. Balaban RS, Nemoto S, Finkel T. Mitochondria, oxidants and aging. Cell. 2005;120:483–495. - PubMed
    1. Carlucci A, Adornetto A, Scorziello A, Viggiano D, Foca M, Cuomo O, Annunziato L, Gottesman M, Feliciello A. Proteolysis of AKAP121 regulates mitochondrial activity during cellular hypoxia and brain ischaemia. EMBO J. 2008a;27:1073–1084. - PMC - PubMed
    1. Carlucci A, Lignitto L, Feliciello A. Control of mytochondrial dynamics, oxidative metabolism by cAMP, AKAPs and proteasome. Trends Cell Biol. 2008b;18:604–613. - PubMed
    1. Chan DC. Mitochondria: dynamic organelles in disease, aging, and development. Cell. 2006;125:1241–1252. - PubMed
    1. Chang CR, Blackstone C. Cyclic AMP-dependent protein kinase phosphorylation of Drp1 regulates its GTPase activity and mitochondrial morphology. J. Biol. Chem. 2007;282:21583–21587. - PubMed

Publication types

MeSH terms

LinkOut - more resources