. 2011 Nov 18;44(4):609-20.
doi: 10.1016/j.molcel.2011.08.042.

NSD2 links dimethylation of histone H3 at lysine 36 to oncogenic programming

Affiliations

NSD2 links dimethylation of histone H3 at lysine 36 to oncogenic programming

Alex J Kuo et al. Mol Cell. .

Abstract

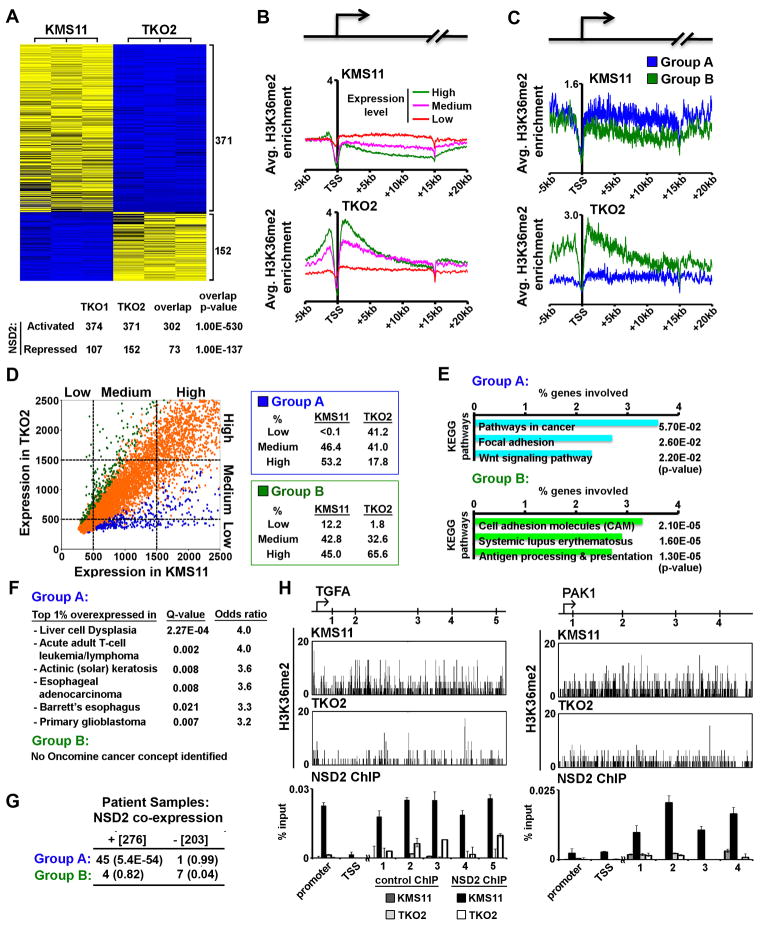
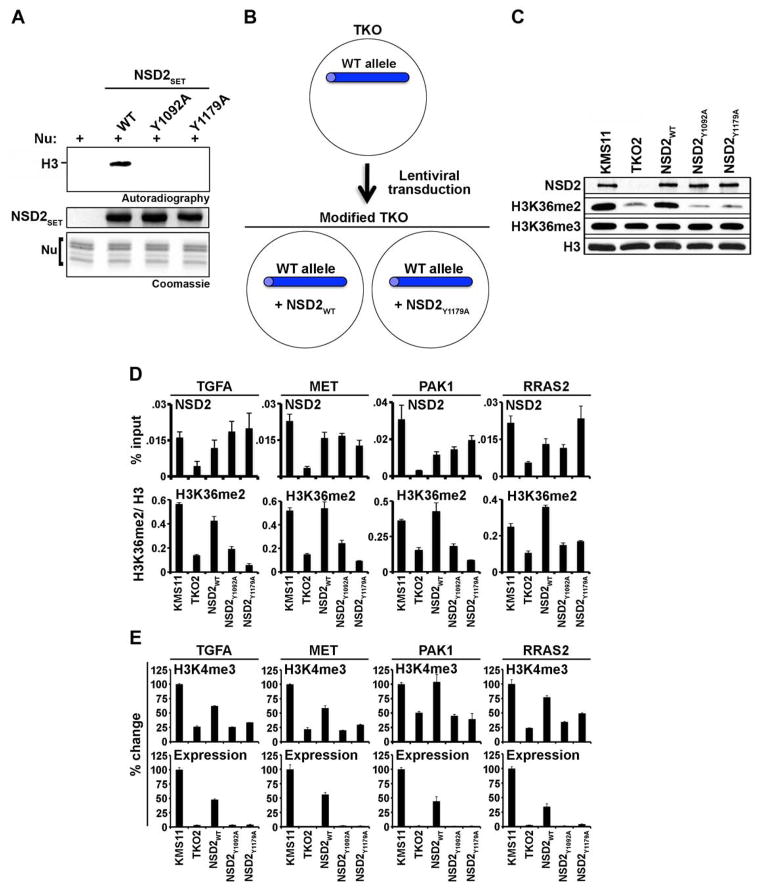
The histone lysine methyltransferase NSD2 (MMSET/WHSC1) is implicated in diverse diseases and commonly overexpressed in multiple myeloma due to a recurrent t(4;14) chromosomal translocation. However, the precise catalytic activity of NSD2 is obscure, preventing progress in understanding how this enzyme influences chromatin biology and myeloma pathogenesis. Here, we show that dimethylation of histone H3 at lysine 36 (H3K36me2) is the principal chromatin-regulatory activity of NSD2. Catalysis of H3K36me2 by NSD2 is sufficient for gene activation. In t(4;14)-positive myeloma cells, the normal genome-wide and gene-specific distribution of H3K36me2 is obliterated, creating a chromatin landscape that selects for a transcription profile favorable for myelomagenesis. Catalytically active NSD2 confers xenograft tumor formation upon t(4;14)-negative cells and promotes oncogenic transformation of primary cells in an H3K36me2-dependent manner. Together, our findings establish H3K36me2 as the primary product generated by NSD2 and demonstrate that genomic disorganization of this canonical chromatin mark by NSD2 initiates oncogenic programming.


Figures

Figure 1
Figure 1. NSD2 mono- and di-methylates H3K36 in vitro
(A) NSD2SET exclusively methylates H3 on native nucleosomes. Autoradiogram of methylation assays on HeLa-purified nucleosomes using the indicated recombinant enzymes. Coomassie stain of histones is shown below. (B) Full-length NSD2 exclusively methylates H3 on native nucleosomes. Autoradiogram and Coomassie of methylation assays as in (A) using full-length NSD2 purified from Sf9 cells. Lane 1: Nucleosome (Nu) only, lane 2: control reaction with IPed material from non-transduced Sf9 cells. Left panel: Coomassie stain of purified full-length NSD2 protein. (C and D) Mono- and di-methylation of H3K36 on recombinant nucleosomes by NSD2. (C) Quantitative mass spectrometry of NSD2SET methylation assays on recombinant nucleosomes. Control reaction lacks NSD2SET. Mass spectrum shows H3K36me0 (Left) peptide levels decrease whereas H3K36me1 (middle) and H3K36me2 (right) peptides are detected upon NSD2SET methylation (see extended methods). No other methylation events (e.g. H3K36me3, H4K20me2) were detected. Arrows: locations where modified peptides are expected in the -NSD2SET reaction. (D) Western analysis of NSD2SET methylation assays as in (C) using the indicated antibodies. (E) NSD2 generates H3K36me1 and H3K36me2 on native nucleosomes. Western analysis with the indicated antibodies of methylation assays with NSD2SET (left panel) and full-length NSD2 (right) on HeLa nucleosomes. Control reaction lacks NSD2. (F) Trimethylation of H3K36 on native nucleosomes by SETD2SET. Western analysis of methylation assays of NSD2SET and SETD2SET on HeLa nucleosomes. Control reaction has no enzyme. (G) NSD2 does not methylate at H4K20. Western analysis of methylation assays of NSD2SET on recombinant H4. Control reaction lacks NSD2SET. Total H4 is shown as a loading control.
Figure 2
Figure 2. NSD2 generates H3K36me2 in cells
(A) NSD2 overexpression increases global H3K36me2 levels in cells. Western analysis with the indicated antibodies of whole cell extract (WCE) from 293T cells transfected with full-length NSD2 or control vector. Total H3 is shown as a loading control. (B) Depletion of NSD2 by RNAi specifically decreases global H3K36me2 level in t(4;14)+ myeloma cells. Western analysis as in (A) of WCE from t(4;14)+ KMS11 myeloma cells stably expressing control shRNA or two independent shRNAs targeting NSD2. (C) Depletion of SETD2 reduces H3K36me3 levels in myeloma cells. Western analysis of WCE as in (B) from KMS11 cells expressing the indicated shRNAs. (D) Depletion of NSD2 specifically decreases global H3K36me2 levels in non-myeloma cancer cell lines. Western analysis with the indicated antibodies of WCE from HT1080 (top panel) and U2OS (bottom panel) cells transfected with control siRNA or two independent siRNAs targeting NSD2. (E) Schematic of KMS11, TKO, and NTKO cell lines (see Lauring et al., 2008). Homologous recombination in t(4;14)+ KMS11 cells targeting either inactivation of the t(4;14)-associated NSD2 allele (TKO) or the wild-type NSD2 allele (NTKO). (F), (G) and (H) Loss of t(4;14)-associated NSD2 expression in myeloma cells leads to depletion of H3K36me2, but not other histone methylation marks. (F) Western analysis of WCE from KMS11, TKO and NTKO cells using the indicated antibodies. (G) Long exposure and quantitation of NSD2 western analysis in the indicated cell lines. (H) Quantitative mass spectrometry of the relative amounts of the indicated methylation events in KMS11 cells versus two independent TKO cell lines. Fold Δ: ratio of KMS11 over TKO samples. ± standard deviation from 2 replicas analyzed in triplicate.
Figure 3
Figure 3. t(4;14)-driven NSD2 overexpression obliterates the normal genome-wide and gene-specific distribution of H3K36me2
(A), (B) and (C) t(4;14)-associated NSD2 overexpression obliterates the normal genome-wide distribution of H3K36me2. (A) H3K36me2 ChIP-seq signals from KMS11 and TKO2 cells across a representative chromosome are shown. Top two insets: H3K36me2 distribution on chromosome 21 in the indicated cell lines. H3K36me2 peak #s are indicated. Bottom two insets: Higher resolution track of H3K36me2 ChIP signal from 23–29 megabasepairs (mb) on chromosome 21. Genes are marked below the track. (B) Percent of H3K36me2-enriched peaks localized to either intergenic (yellow) or intragenic (purple) regions throughout the genome in KMS11 and TKO2 cells. Number of H3K36me2 peaks in each cell line is shown. (C) Distribution of nucleotides associated with the indicated number of H3K36me2 ChIP-seq reads mapping to intergenic (yellow) and intragenic (purple) regions in KMS11 and TKO2 cells. p-values are calculated for the indicated read thresholds. The intergenic versus intragenic composition of the whole genome is shown. (D) Normal H3K36me2 distribution within genes is abolished in t(4;14)+ myeloma cells. Average H3K36me2 ChIP signal across 20,910 annotated genes in KMS11 (left; blue) and TKO2 (right; red) cells. The transcribed bodies of all genes were normalized to 15 kilobasepairs (kb). The arrow in the schematic illustrates the TSS.
Figure 4
Figure 4. NSD2 activates transcription and promotes an oncogenic program in KMS11 cells
(A) Depletion of NSD2 by targeted inactivation of t(4;14)-associated NSD2 allele in KMS11 cells correlates with global downregulation of transcription. Genome-wide expression profiling of KMS11 cells in comparison to the two TKO cell lines. Top: heatmap representation of differentially expressed genes in TKO2 versus KMS11 cells (n=3). Numerical expression values for each gene were median centered and scaled to range from −1.0 (blue; low expression) to 1.0 (yellow; high expression). Bottom: overlap of differentially expressed genes between the two TKO cell lines. Activated: upregulated in KMS11/TKO cells; repressed: downregulated in KMS11/TKO cells. p-values: statistical significance of the overlap. (B) Positive correlation between H3K36me2 enrichment and gene expression is abolished by NSD2 overexpression. Average H3K36me2 profile in the indicated cell lines across the 20,910 annotated genes separated into three groups based on absolute expression units from the datasets described in (A). (C) In KMS11 cells, H3K36me2 levels are elevated at NSD2-dependent upregulated genes. The average H3K36me2 profile in the indicated cell lines across the top 500 genes upregulated in KMS11/TKO2 cells (Group A: blue) and the top 500 genes downregulated in KMS11/TKO2 cells (Group B: green). (D) NSD2 promotes expression of normally silent genes. Top: scatter plot of absolute gene transcript levels for 20,910 annotated genes in KMS11 versus TKO2 cells. The percent of Group A (blue) and Group B (green) genes that fall within the 3 expression quantile categories (low, medium, and high) is shown at right. (E) t(4;14)-driven NSD2 overexpression promotes expression of genes involved in cancer-signaling pathways. KEGG pathway analysis of group A and group B genes using p-value cutoff=0.1 and sorted by the percentage of genes within a functional group. (F) Genes upregulated in t(4;14)+ myeloma cells constitute a common signature in diverse cancers. Oncomine cancer concept analysis of group A and B genes with genes overexpressed in different cancers using Q-value cutoff=0.05 and odds ratio cutoff=3. Significant cancer concepts sorted by the odds ratio. (G) Genes upregulated in t(4;14)+ KMS11 cells are co-expressed with NSD2 in myeloma patient samples. Table: number of genes that positively (276) or negatively (203) correlate with NSD2 expression in the Multiple Myeloma Research Consortium patient sample database and the overlap with group A and B genes. p-values: statistical significance of the overlap. (H) NSD2 directly binds at target genes. ChIP analysis of NSD2 occupancy across the TGFA and PAK1 genes in KMS11 and TKO2 cells. Top: schematics of the two genes. Arrow indicates the TSS and numbers the location of ChIP primer pairs. Middle: snapshot of H3K36me2 ChIP-seq signal at TGFA and PAK1 in the indicated cell lines. Bottom: NSD2 ChIP signals at the indicated primer pairs. Protein A beads used in control ChIP. Error bars indicate the standard error of the mean (s.e.m.) from 3 experiments.
Figure 5
Figure 5. NSD2 catalytic activity is required for transcriptional activation at oncogenic loci
(A) Identification of catalytically inactive NSD2 mutants. Top: autoradiogram of in vitro methylation assay with NSD2SET and the two mutants (Y1092A and Y1179A) on native nucleosomes. Coomassie stain of NSD2SET proteins (middle panel) and nucleosomes (bottom panel) is shown. (B) Schematic of NSD2 cellular reconstitution system. Full-length NSD2 or catalytically inactive NSD2 (NSD2Y1092A, and NSD2Y1179A) were introduced into TKO2 cells by lentiviral transduction. (C) Complementation of TKO2 cells with NSD2WT but not catalytically inactive NSD2 increases global H3K36me2 to KMS11 levels. Western analysis of WCE from KMS11 cells, TKO2 cells, and TKO2 cells stably transduced with wild-type or catalytically inactive NSD2. (D and E) Complementation of TKO2 cells with NSD2WT but not with catalytic mutants increases H3K36me2 levels at target oncogenes and activates expression of these genes. (D) ChIP analyses of NSD2 occupancy (top; y axis: %input) and H3K36me2 signal (bottom; y axis: H3K36me2/H3) at four genes at the location indicated in Figures 4H and S3F: TGFA (#4), MET (#2), PAK1 (#2) and RRAS2 (#5). Error bars indicate s.e.m. from 3 experiments. (E) ChIP analyses of H3K4me3 levels at promoter regions (top) and quantitative RT-PCR analysis of mRNA transcripts (bottom) of the genes in (D).
Figure 6
Figure 6. Catalytically active NSD2 confers tumorigenicity upon t(4;14) negative cells
(A) Complementation with NSD2WT but not catalytically inactive NSD2 accelerates the proliferation rate of TKO2 cells. Cell numbers in the indicated lines were determined over 9 days. Error bars indicate s.e.m. from 3 independent experiments. (B) Complementation of TKO2 cells with NSD2WT but not with NSD2Y1179A promotes anchorage-independent growth. The ability of the indicated cells lines to grow colonies in methylcellulose is shown. Bar graph indicates # of colonies/per field 21 days after seeding. Error bars indicate s.e.m. from 3 independent experiments. (C and D) Catalytically active NSD2 confers xenograft tumor formation and invasion capacity upon t(4;14)-negative cells. (C) KMS11, TKO2, NSD2, and NSD2Y1179A cell lines stably expressing GFP-luciferase biomarkers were introduced into SCID/Beige mice via intraperitoneal injection. Top: western analysis of WCE using anti-GFP antibodies. Total H3 is shown as a loading control. Middle: # of tumor-bearing mice at day 28 from 2 independent experiments. Bottom: representative bioluminescent images of mice 4 weeks after injection. (D) Cell lines as in (C) were introduced into non-irradiated SCID/Beige mice via intravenous tail vein injection. Top: western analysis of WCE as in (C). Middle: # of tumor-bearing mice at day 28. Bottom: representative bioluminescent images of mice 4 weeks after injection.
Figure 7
Figure 7. NSD2 is an oncoprotein that contributes to the tumorigenicity of various cancers
(A) and (B) NSD2 upregulation in diverse cancers present in the Oncomine database. (A) # of Oncomine datasets in which NSD2 is differentially expressed relative to controls w/cutoffs of >3-fold change and p-value<0.05. Red: upregulated; blue: downregulated. (B) Boxplots indicate (from top to bottom) the maximum, 75th percentile, median, 25th percentile and minimum of 15 representative datasets in which NSD2 is upregulated in cancer (C) tissue (grey) compared to normal (N) tissue. A, cutaneous melanoma; B, ductal breast carcinoma; C, skin squamous cell carcinoma; D, infiltrating bladder urothelial carcinoma; E, lung adenocarcinoma; F, skin squamous melanoma; G, gastric intestinal type adenocarcinoma; H, gastric mixed adenocarcinoma; I, esophageal adenocarcinoma; J, ovarian serous cystadenocarcinoma; K, acute myeloid leukemia; L, fibrosarcoma; M, malignant fibrous histiocytoma; N, synovial sarcoma; O, leiomyosarcoma. (C) Complementation with NSD2WT but not catalytically inactive NSD2 increases global H3K36me2 levels in t(4;14) myeloma cells. Western analysis of WCE from the t(4;14) KMS12-PE (left) and U266 (right) cell lines stably transduced with NSD2WT, NSD2Y1179A or empty virus. (D) and (E) NSD2 but not NSD2Y1179A increases proliferation and anchorage independent growth of t(4;14) myeloma cells. Growth curves of the cell lines in (C) were determined as in Figure 6A. (E) Methylcellulose colony formation assay of cell lines as in Figure 6B. Error bars for (D) and (E) indicate s.e.m. from at least 3 independent experiments. (F) NSD2 but not NSD2Y1179A promotes oncogenic transformation of p19ARF−/− MEFs. Left: western analysis of WCE from p19ARF−/− MEFs stably transduced with NSD2WT, NSD2Y1179A or empty virus. Right: numbers of colonies formed in methylcellulose for each cell line. Error bars indicate s.e.m. from 3 independent experiments. (G and H) NSD2 increases H3K36me2 at and expression of Fos, Igf2, Figf, and Mdk in p19ARF−/− MEFs. (G) Quantitative RT-PCR analysis of the transcript levels of the indicated genes. (H) H3K36me2 ChIP in the transcribed bodies of the indicated genes. Error bars indicate s.e.m. from 3 experiments.

Similar articles

Cited by

References

    1. Anderson KC, Carrasco RD. Pathogenesis of myeloma. Annu Rev Pathol. 2011;6:249–274. - PubMed
    1. Bannister AJ, Schneider R, Myers FA, Thorne AW, Crane-Robinson C, Kouzarides T. Spatial distribution of di- and tri-methyl lysine 36 of histone H3 at active genes. J Biol Chem. 2005;280:17732–17736. - PubMed
    1. Bell O, Wirbelauer C, Hild M, Scharf AN, Schwaiger M, MacAlpine DM, Zilbermann F, van Leeuwen F, Bell SP, Imhof A, et al. Localized H3K36 methylation states define histone H4K16 acetylation during transcriptional elongation in Drosophila. Embo J. 2007;26:4974–4984. - PMC - PubMed
    1. Bua DJ, Kuo AJ, Cheung P, Liu CL, Migliori V, Espejo A, Casadio F, Bassi C, Amati B, Bedford MT, et al. Epigenome microarray platform for proteome-wide dissection of chromatin-signaling networks. PLoS One. 2009;4:e6789. - PMC - PubMed
    1. Chesi M, Nardini E, Lim RS, Smith KD, Kuehl WM, Bergsagel PL. The t(4;14) translocation in myeloma dysregulates both FGFR3 and a novel gene, MMSET, resulting in IgH/MMSET hybrid transcripts. Blood. 1998;92:3025–3034. - PubMed

Publication types

MeSH terms

Associated data