. 2011 Nov 17;10(5):515-26.
doi: 10.1016/j.chom.2011.09.012.

Viral microRNA targetome of KSHV-infected primary effusion lymphoma cell lines

Affiliations

Viral microRNA targetome of KSHV-infected primary effusion lymphoma cell lines

Eva Gottwein et al. Cell Host Microbe. .

Abstract

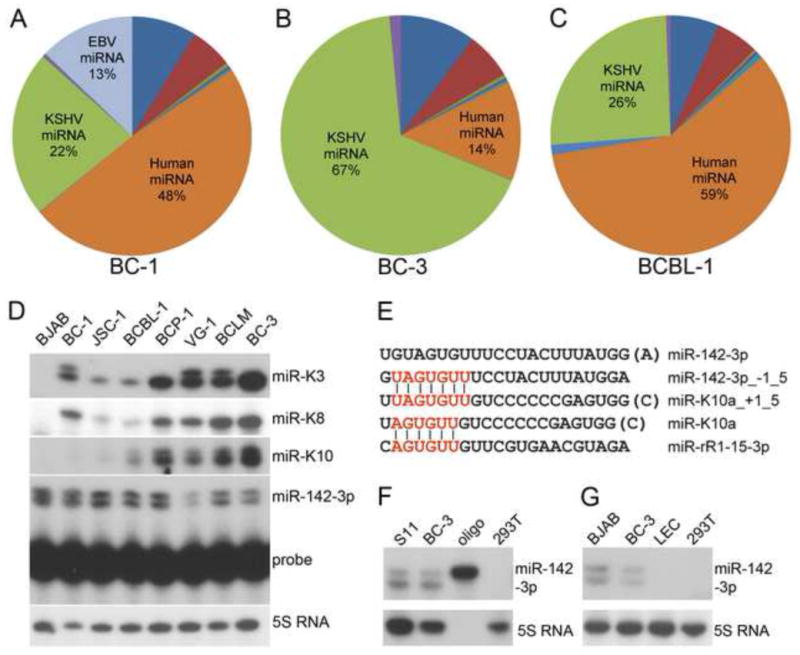
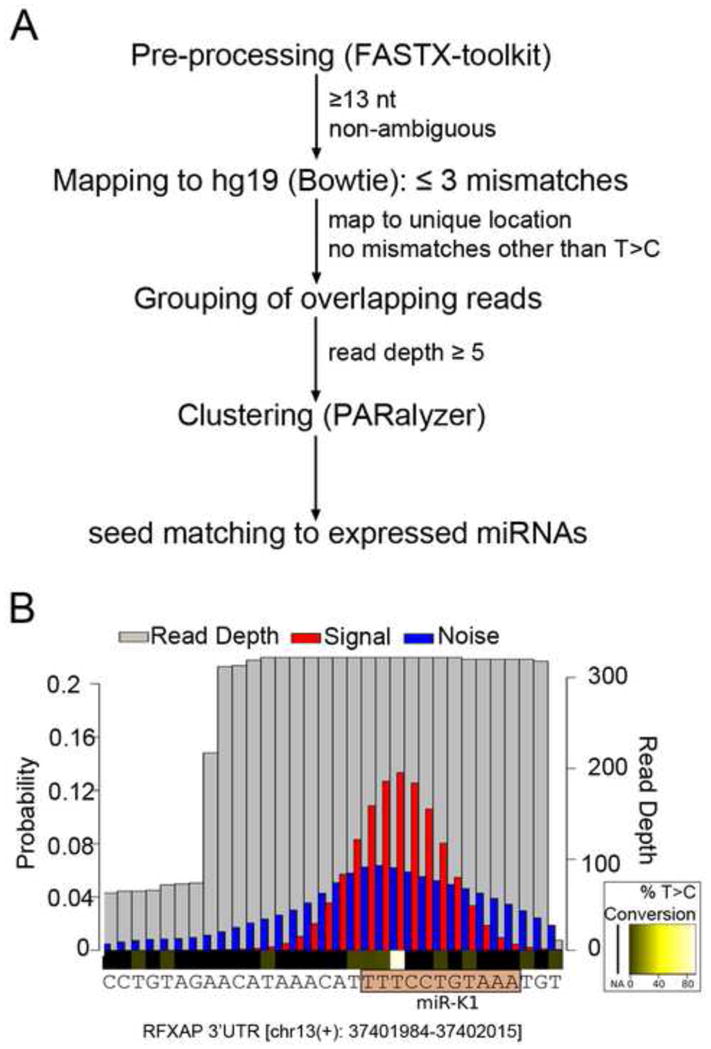
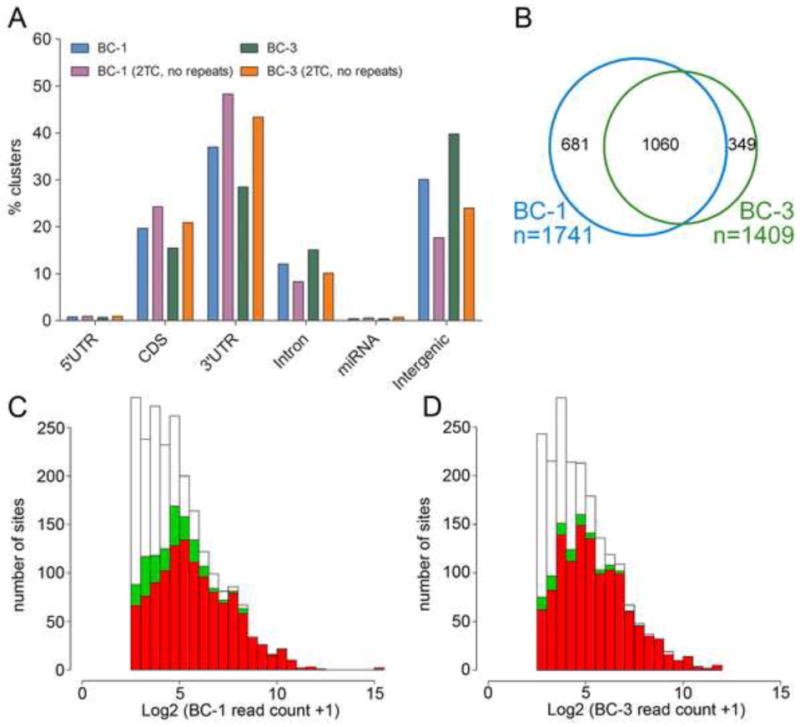
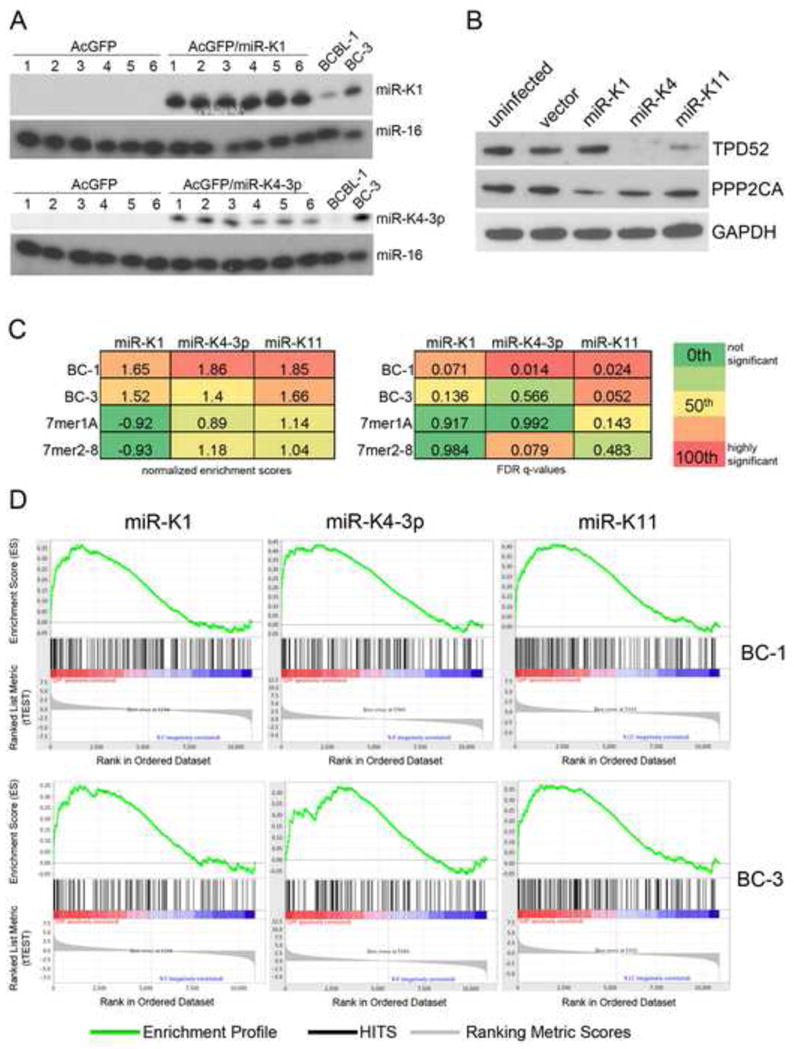
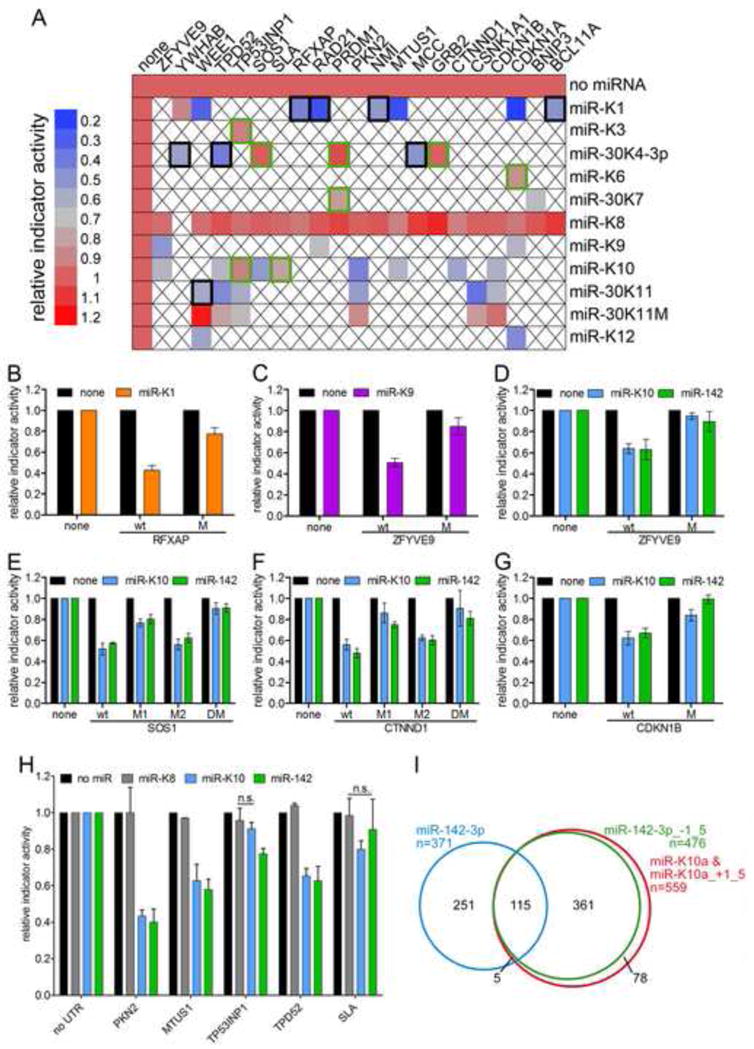
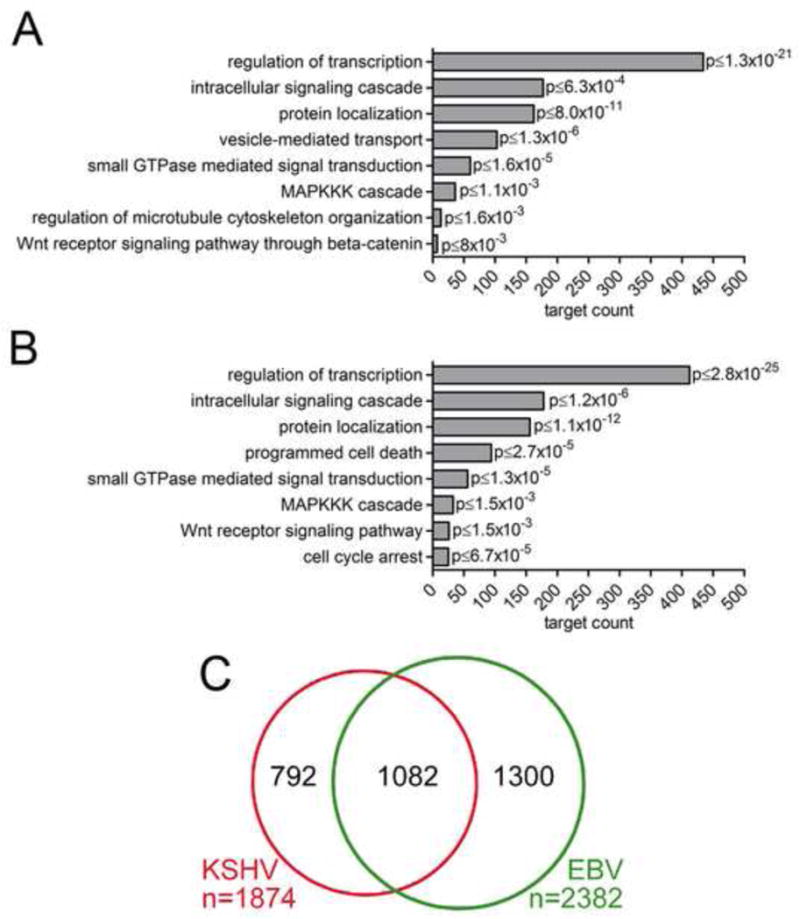
Primary effusion lymphoma (PEL) is caused by Kaposi's sarcoma-associated herpesvirus (KSHV) and frequently also harbors Epstein-Barr virus (EBV). The expression of KSHV- and EBV-encoded microRNAs (miRNAs) in PELs suggests a role for these miRNAs in latency and lymphomagenesis. Using PAR-CLIP, a technology which allows the direct and transcriptome-wide identification of miRNA targets, we delineate the target sites for all viral and cellular miRNAs expressed in PEL cell lines. The resulting data set revealed that KSHV miRNAs directly target more than 2000 cellular mRNAs, including many involved in pathways relevant to KSHV pathogenesis. Moreover, 58% of these mRNAs are also targeted by EBV miRNAs, via distinct binding sites. In addition to a known viral analog of cellular miR-155, we show that KSHV encodes a viral miRNA that mimics cellular miR-142-3p function. In summary, this study identifies an extensive list of KSHV miRNA targets, which are likely to influence viral replication and pathogenesis.


Figures

Figure 1
Figure 1. Small RNA sequencing
(A–C) Genomic location of aligned small RNA reads. For a detailed breakdown, see Table S1. (D) Primer extension analysis of miRNA expression in an extended set of PEL cell lines. miR-K10a was easily detected in BC-1 and JSC-1 cells upon longer exposure (not shown). (E) Alignment of miR-K10a and miR-142-3p sequences. −/+1_5 indicates a 5′ terminal offset from the miRBase sequence by 1 nucleotide. The seed sequence of miR-K10a is also identical to that of rhesus lymphocryptovirus miR-rR1-15-3p (Umbach et al., 2010). (F) Primer extension analysis of miR-142-3p in BC-3 cells and the murine B cells line S11. 293T was used as a negative control (G) primer extension analysis of miR-142-3p expression (top panel) in BJAB, BC-3 and lymphatic endothelial cells (LEC). 5S RNA served as loading control. See also Tables S1–4.
Figure 2
Figure 2. Computational analysis of PAR-CLIP data
(A) Flowchart outlining the computational pipeline used for PAR-CLIP analysis. (B) Example of PARalyzer cluster identification. A BC-1 derived cluster mapping to the 3′UTR of RFXAP with a seed match to miR-K1 is shown. Shown are read depth (grey) and the distributions of T to C conversions (red, signal) and non-converted Ts (blue, noise). The seed match to miR-K1 is highlighted. This seed match is validated further below.
Figure 3
Figure 3. Characteristics of BC-1 and BC-3 PAR-CLIP libraries
(A) Location of PAR-CLIP clusters within the human genome. “2TC, no repeats”: only clusters not mapping to repeats and with T to C conversions at ≥ 2 locations were analyzed. (B) Venn diagram showing the overlap of mRNAs with 3′UTR sites for KSHV miRNAs between BC-1 and BC-3 libraries. Only KSHV miRNAs expressed in both cell lines were considered. (C) Read depth for KSHV miRNA targets sites found in BC-1 (white), read depth for the subset of these clusters that were also recovered in BC-3 with ≥ 1 (green) or ≥2 (red) locations with T to C conversions. (D) as in (C), except that sites from BC-3 are in white and the sites that are also recovered in BC-1 are in green and red. See also Tables S5, 6.
Figure 4
Figure 4. PAR-CLIP targets of KSHV miRNAs are downregulated at the mRNA level
(A) Primer extension analysis of BJAB cell pools stably expressing KSHV miR-K1 (upper) or miR-K4-3p (lower). miR-16 served as a loading control. (B) Western Blot analysis of TPD52 and PPP2CA expression in untransduced BJAB cells and transductants stably expressing the control vector or the indicated miRNA. GAPDH expression served as loading control. (C) Normalized enrichment scores (NES) and FDR q-values for the enrichment of PAR-CLIP targets of the indicated miRNA from BC-1 or BC-3 libraries in the corresponding microarray data. Also shown are data for the enrichment of either 7mer1A or 7mer2-8 seed matches in the array data. (D) Gene set enrichment plots showing the enrichment of PAR-targets of the indicated miRNA from BC-1 or BC-3 libraries in the corresponding rank-ordered gene lists. See also Table S10.
Figure 5
Figure 5. Validation of PAR-CLIP targets by 3′UTR indicator assays
(A) Heatmap summarizing 3′UTR indicator data obtained with combinations of 3′UTR indicators (columns) and miRNA expression vectors (rows) as indicated. Expression of miR-K1 (YWHAB), miR-K8 (all other 3′UTRs) or seed mutant miR-K11 served as negative controls. Other than controls, 37 interactions were tested, all predicted by PAR-CLIP, with the exception of CDKN1B/miR-K11. Black boxes mark mRNAs that were downregulated in microarray data. Regulation was statistically significant (p<0.05, n≥3), except where indicated by green boxes. Empty boxes: not tested. (B) The miR-K1 seed match in the 3′UTR of RFXAP was inactivated by mutation (CTGTAA to CAGTTA). (C) The seed match to miR-K9-3p in the 3′UTR of ZFYVE9 was inactivated by mutation (TACCCA to TTCCGA) (D–G) Seed matches to miR-K10/miR-142-3p in the ZFYVE9 (D), SOS1 (E), CTNND1 (F) and CDKN1B (G) 3′UTRs were inactivated (ACACTA to AGACAA) alone (M, M1, M2) or in combination (DM). (H) Additional miR-K10 candidate targets were tested for regulation by miR-142-3p. Expression of miR-K8 served as negative control. All error bars represent s.d. (n≥3). See also Figure S1. (I) Overlap of mRNAs with 3′UTR clusters assigned to seed variants of miR-K10 and miR-142-3p.
Figure 6
Figure 6. Properties of KSHV miRNA targets
(A) Selected pathways with significant enrichments of KSHV miRNA targets. p values shown were calculated against the background of the human genome, but remained significant (p<0.05) when calculated against mRNAs expressed in both PEL cell lines or transcripts with PAR-CLIP clusters. (B) Selected pathways with significant enrichments of EBV miRNA targets. p values were calculated against human genome, all pathways shown remained significant when calculated against expressed mRNAs or transcripts with PAR-CLIP clusters in BC-1 cells. (C) Overlap of KSHV and EBV 3′UTR target mRNAs with T to C conversions at minimally 2 locations identified in BC-1. See also Tables S8, 12.

References

    1. Abend JR, Uldrick T, Ziegelbauer JM. Regulation of tumor necrosis factor-like weak inducer of apoptosis receptor protein (TWEAKR) expression by Kaposi’s sarcoma-associated herpesvirus microRNA prevents TWEAK-induced apoptosis and inflammatory cytokine expression. J Virol. 2010;84:12139–12151. - PMC - PubMed
    1. Bartel DP. MicroRNAs: target recognition and regulatory functions. Cell. 2009;136:215–233. - PMC - PubMed
    1. Bellare P, Ganem D. Regulation of KSHV lytic switch protein expression by a virus-encoded microRNA: an evolutionary adaptation that fine-tunes lytic reactivation. Cell Host Microbe. 2009;6:570–575. - PMC - PubMed
    1. Cai X, Lu S, Zhang Z, Gonzalez CM, Damania B, Cullen BR. Kaposi’s sarcoma-associated herpesvirus expresses an array of viral microRNAs in latently infected cells. Proc Natl Acad Sci U S A. 2005;102:5570–5575. - PMC - PubMed
    1. Cai X, Schafer A, Lu S, Bilello JP, Desrosiers RC, Edwards R, Raab-Traub N, Cullen BR. Epstein-Barr virus microRNAs are evolutionarily conserved and differentially expressed. PLoS Pathog. 2006;2:e23. - PMC - PubMed

Publication types