. 2012 Feb;53(2):325-30.
doi: 10.1194/jlr.D021808. Epub 2011 Nov 18.

Enzymatic measurement of phosphatidylserine in cultured cells

Affiliations

Enzymatic measurement of phosphatidylserine in cultured cells

Shin-ya Morita et al. J Lipid Res. 2012 Feb.

Abstract

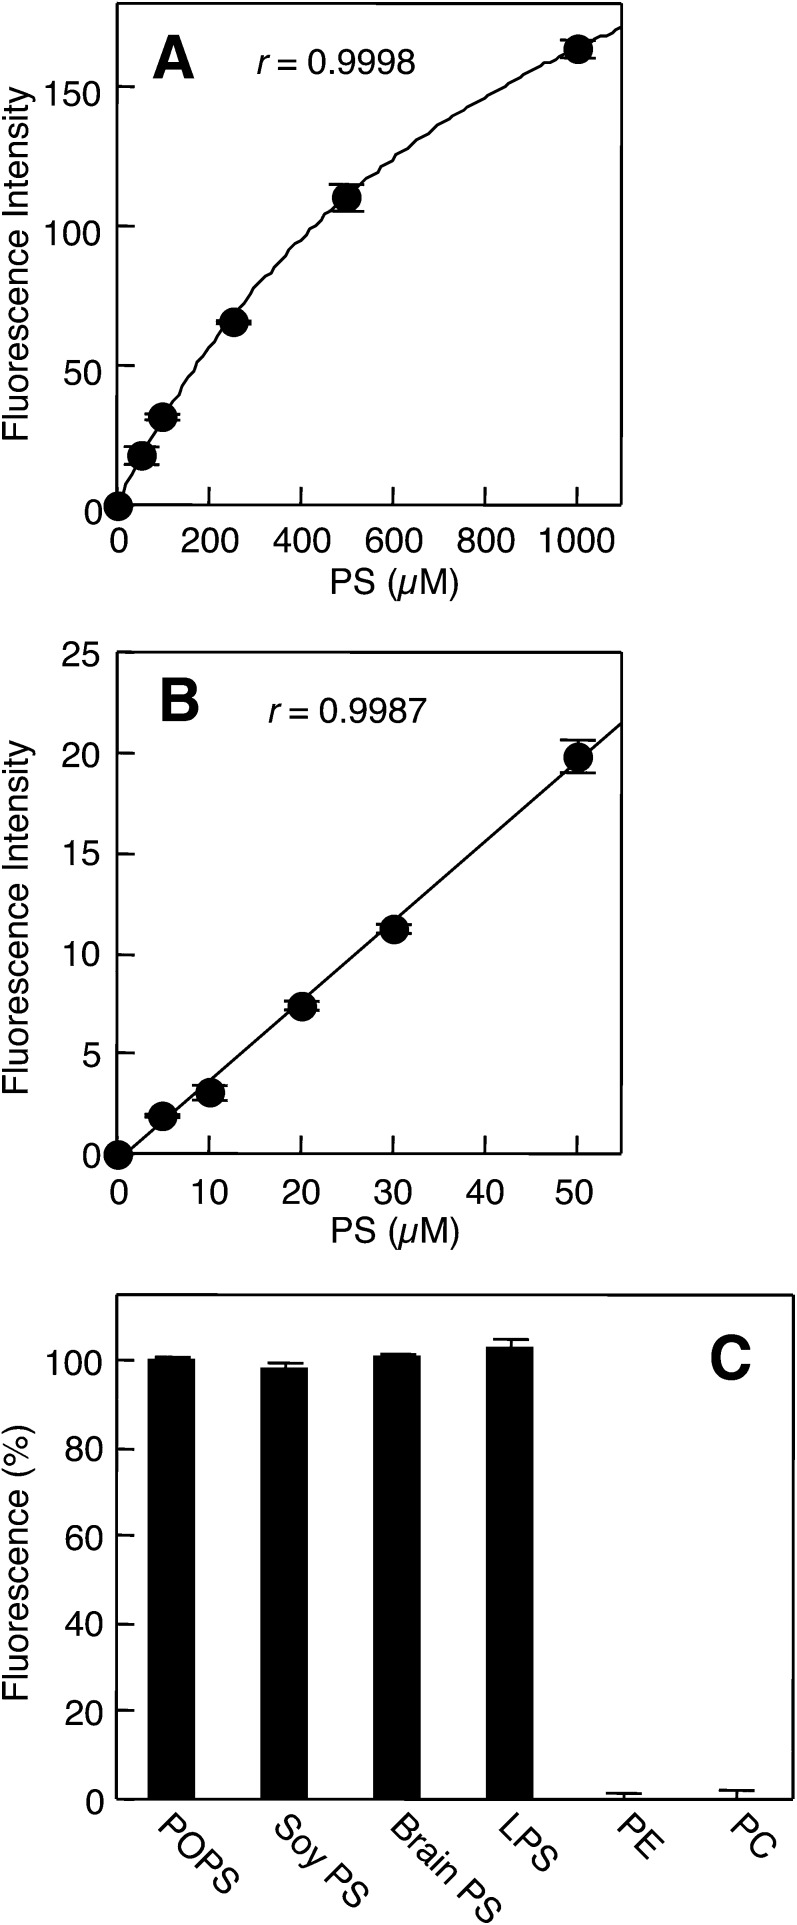
Phosphatidylserine (PS) is a quantitatively minor membrane phospholipid involved in diverse cellular functions. In this study, we developed a new fluorometric method for measuring PS using combinations of specific enzymes and Amplex Red. The calibration curve for PS measurement was linear and hyperbolic at low (0-50 µM) and high (50-1000 µM) concentrations, respectively, and the detection limit was 5 µM (50 pmol in the reaction mixture). This assay quantified PS regardless of the chain length and the number of double bonds. We applied this new method to the determination of PS content in HEK293 cells, which was validated by a recovery study and comparison with TLC-phosphorus assay. We showed that the PS content was high in sparse cells. The overexpression of PS synthase 1 elevated not only the cellular PS content but also the phosphatidylcholine (PC) and phosphatidylethanolamine (PE) contents, suggesting the conversion of PS into PE and the enhancement of PC production. This new assay for PS measurement is simple, specific, sensitive, and high throughput, and it will be useful to clarify the metabolism and biological functions of PS.


Figures

Fig.1.
Fig.1.
Strategy for PS measurement. PLD catalyzes the hydrolysis of PS to PA and serine. Oxidation of serine is catalyzed by LAAO, which produces hydrogen peroxide. In the presence of peroxidase, Amplex Red reacts with hydrogen peroxide to produce highly fluorescent resorufin, which can be measured.
Fig.2.
Fig.2.
Enzymatic measurement of PS. A, B: Standard curves for PS measurement. The POPS standard solution was added to Reagent S1 and incubated at 25°C for 240 min. Then, Reagent S2 was added. After 15 min of incubation at room temperature, Stop Reagent was added. The fluorescence intensity was measured using a fluorescence microplate reader. Background fluorescence was 11.7 ± 0.1 (A) or 14.3 ± 0.1 (B), which was subtracted from each value. Each point represents the mean ± SD of triplicate measurements. The lines were obtained by hyperbolic regression analysis (A) and linear regression analysis (B). The correlation coefficients were r = 0.9998 (A) and r = 0.9987 (B). C: Fluorescence changes in response to POPS, soy PS, brain PS, LPS, PE, and PC in PS measurement. Each bar represents the mean ± SD of triplicate measurements. There were no statistically significant differences among POPS, soy PS, brain PS, and LPS.
Fig.3.
Fig.3.
Comparison of enzymatic assay for measuring PS content in lipid extract from HEK293 cells with TLC-phosphorus assay. The correlation coefficients and the regression line were r = 0.9803 and y = −0.8007 + 0.9999×, respectively. n = 30.
Fig.4.
Fig.4.
Effect of cell density on PS content in HEK293 cells. HEK293 cells on 10 cm dishes were incubated in MEM containing 0.02% BSA for 18 h at 37°C. The PS content in HEK293 cells was determined by the enzymatic measurement and protein assay. Each point represents the mean ± SE of three measurements. *P < 0.05, significantly different from the PS content at all other cell densities.
Fig.5.
Fig.5.
Immunoblot analysis of PSS1. Cell lysates (25.0 µg of protein) from HEK293 and HEK/myc-PSS1 cells were separated by 10% SDS-PAGE. The N-terminus of PSS1 was fused to the myc-tag, and myc-PSS1 was detected with an anti-c-Myc antibody. Endogenous PSS1 and myc-PSS1 were detected with a polyclonal anti-PSS1 antibody.
Fig.6.
Fig.6.
Effect of PSS1 overexpression on membrane phospholipid composition. HEK293 and HEK/myc-PSS1 cells on 10 cm dishes were incubated in MEM containing 0.02% BSA for 18 h at 37°C. There was no difference in the densities of HEK293 and HEK/myc-PSS1 cells (73.1 ± 2.4 and 68.4 ± 2.0 µg protein/cm2, respectively). PS content (A), PC content (B), PE content (C), PS/PC ratio (D), PE/PC ratio (E), and PS/PE ratio (F) of the cells were determined by enzymatic measurements of PS, PC, and PE, and protein assay. Each bar represents the mean ± SE of three measurements. *P < 0.05, significantly different from HEK293 cells.

Similar articles

Cited by

References

    1. Vance J. E. 2008. Phosphatidylserine and phosphatidylethanolamine in mammalian cells: two metabolically related aminophospholipids. J. Lipid Res. 49: 1377–1387. - PubMed
    1. Kuge O., Nishijima M. 1997. Phosphatidylserine synthase I and II of mammalian cells. Biochim. Biophys. Acta. 1348: 151–156. - PubMed
    1. Tomohiro S., Kawaguti A., Kawabe Y., Kitada S., Kuge O. 2009. Purification and characterization of human phosphatidylserine synthases 1 and 2. Biochem. J. 418: 421–429. - PubMed
    1. Matsumoto K. 1997. Phosphatidylserine synthase from bacteria. Biochim. Biophys. Acta. 1348: 214–227. - PubMed
    1. Yamashita S., Nikawa J. 1997. Phosphatidylserine synthase from yeast. Biochim. Biophys. Acta. 1348: 228–235. - PubMed

Publication types

Substances

LinkOut - more resources