

NeuroQuest: a comprehensive analysis tool for extracellular neural ensemble recordings
- PMID: 22101141
- PMCID: PMC3249474
- DOI: 10.1016/j.jneumeth.2011.10.027
NeuroQuest: a comprehensive analysis tool for extracellular neural ensemble recordings
Abstract
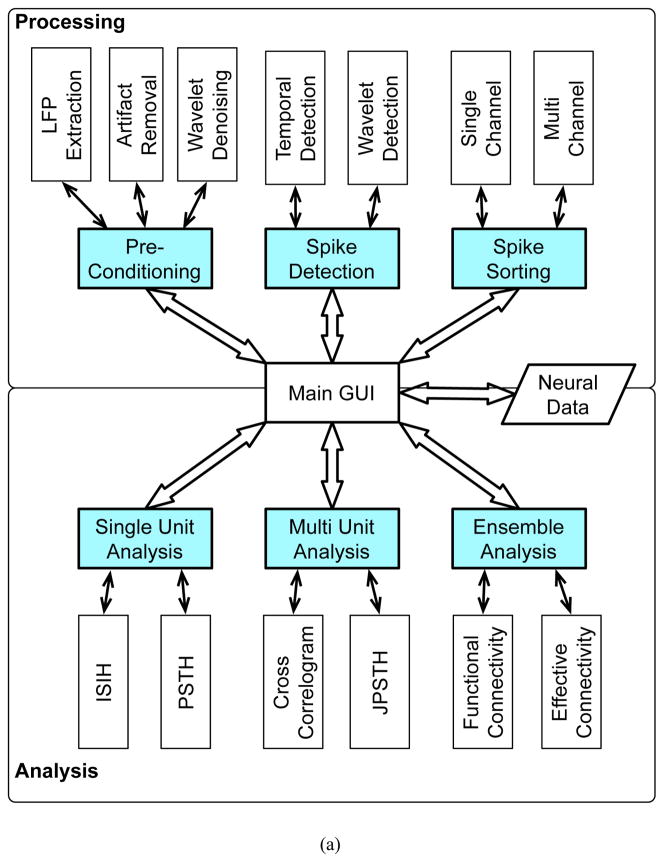
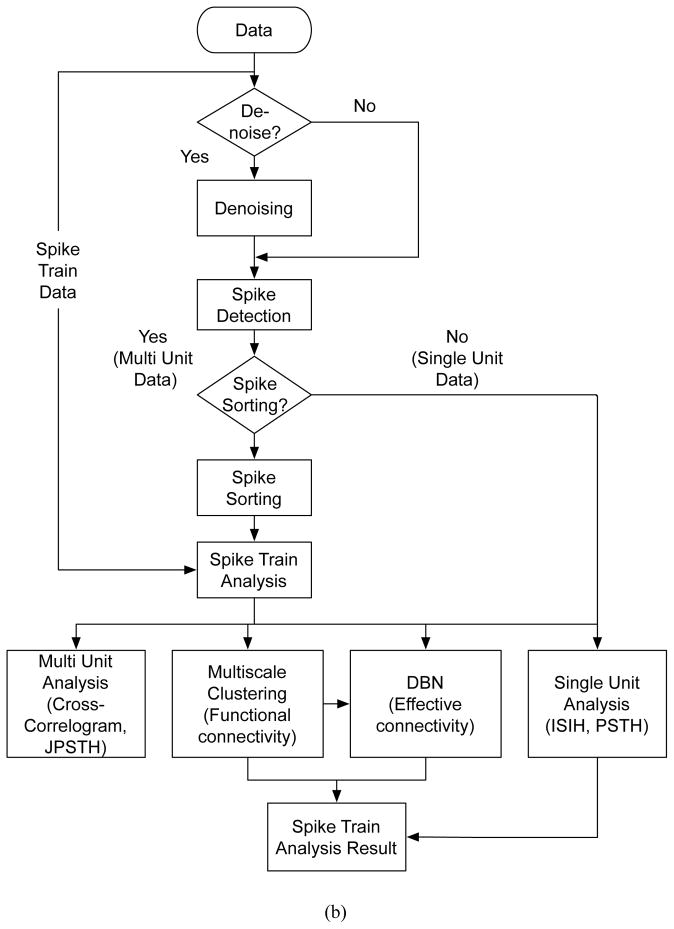
Analyzing the massive amounts of neural data collected using microelectrodes to extract biologically relevant information is a major challenge. Many scientific findings rest on the ability to overcome these challenges and to standardize experimental analysis across labs. This can be facilitated in part through comprehensive, efficient and practical software tools disseminated to the community at large. We have developed a comprehensive, MATLAB-based software package - entitled NeuroQuest - that bundles together a number of advanced neural signal processing algorithms in a user-friendly environment. Results demonstrate the efficiency and reliability of the software compared to other software packages, and versatility over a wide range of experimental conditions.
Copyright © 2011 Elsevier B.V. All rights reserved.
Figures
Similar articles
-
BioS: a new tool for biopotential experiments.Annu Int Conf IEEE Eng Med Biol Soc. 2007;2007:5190-3. doi: 10.1109/IEMBS.2007.4353511. Annu Int Conf IEEE Eng Med Biol Soc. 2007. PMID: 18003177
-
Nexa: a scalable neural simulator with integrated analysis.Network. 2012;23(4):254-71. doi: 10.3109/0954898X.2012.737087. Epub 2012 Nov 1. Network. 2012. PMID: 23116128
-
SigMate: A MATLAB-based neuronal signal processing tool.Annu Int Conf IEEE Eng Med Biol Soc. 2010;2010:1352-5. doi: 10.1109/IEMBS.2010.5626747. Annu Int Conf IEEE Eng Med Biol Soc. 2010. PMID: 21096329
-
On the design of script languages for neural simulation.Network. 2012;23(4):150-6. doi: 10.3109/0954898X.2012.716902. Epub 2012 Aug 16. Network. 2012. PMID: 22897420 Review.
-
Simulating spiking neural networks on GPU.Network. 2012;23(4):167-82. doi: 10.3109/0954898X.2012.730170. Epub 2012 Oct 15. Network. 2012. PMID: 23067314 Review.
Cited by
-
QSpike tools: a generic framework for parallel batch preprocessing of extracellular neuronal signals recorded by substrate microelectrode arrays.Front Neuroinform. 2014 Mar 19;8:26. doi: 10.3389/fninf.2014.00026. eCollection 2014. Front Neuroinform. 2014. PMID: 24678297 Free PMC article.
-
Algorithm and software to automatically identify latency and amplitude features of local field potentials recorded in electrophysiological investigation.Source Code Biol Med. 2017 Feb 7;12:3. doi: 10.1186/s13029-017-0062-5. eCollection 2017. Source Code Biol Med. 2017. PMID: 28191033 Free PMC article.
-
Converging Robotic Technologies in Targeted Neural Rehabilitation: A Review of Emerging Solutions and Challenges.Sensors (Basel). 2021 Mar 16;21(6):2084. doi: 10.3390/s21062084. Sensors (Basel). 2021. PMID: 33809721 Free PMC article. Review.
-
A deep convolutional visual encoding model of neuronal responses in the LGN.Brain Inform. 2021 Jun 15;8(1):11. doi: 10.1186/s40708-021-00132-6. Brain Inform. 2021. PMID: 34129111 Free PMC article.
-
How many neurons can we see with current spike sorting algorithms?J Neurosci Methods. 2012 Oct 15;211(1):58-65. doi: 10.1016/j.jneumeth.2012.07.010. Epub 2012 Jul 25. J Neurosci Methods. 2012. PMID: 22841630 Free PMC article.
References
-
- Bezdek JC, Ehrlich R. FCM: The fuzzy c-means clustering algorithm. Computers & Geosciences. 1984;10:191–203.
-
- Brown E, Kass R, Mitra P. Multiple neural spike train data analysis: state-of-the-art and future challenges. Nature Neuroscience. 2004;7:456–461. - PubMed
-
- Bullmore E, Sporns O. Complex brain networks: graph theoretical analysis of structural and functional systems. Nature Reviews Neuroscience. 2009;10:186–198. - PubMed
Publication types
MeSH terms
Grants and funding
LinkOut - more resources
Full Text Sources
Other Literature Sources
