. 2012 Jan 4;31(1):71-82.
doi: 10.1038/emboj.2011.381. Epub 2011 Nov 18.

Cohesin acetyltransferase Esco2 is a cell viability factor and is required for cohesion in pericentric heterochromatin

Affiliations

Cohesin acetyltransferase Esco2 is a cell viability factor and is required for cohesion in pericentric heterochromatin

Gabriela Whelan et al. EMBO J. .

Abstract

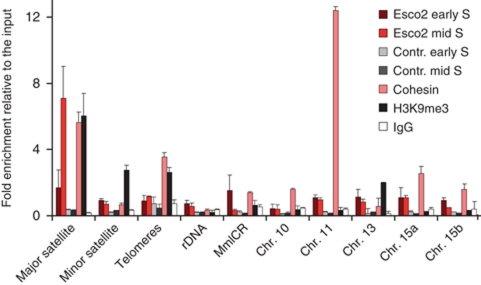
Sister chromatid cohesion, mediated by cohesin and regulated by Sororin, is essential for chromosome segregation. In mammalian cells, cohesion establishment and Sororin recruitment to chromatin-bound cohesin depends on the acetyltransferases Esco1 and Esco2. Mutations in Esco2 cause Roberts syndrome, a developmental disease in which mitotic chromosomes have a 'railroad' track morphology. Here, we show that Esco2 deficiency leads to termination of mouse development at pre- and post-implantation stages, indicating that Esco2 functions non-redundantly with Esco1. Esco2 is transiently expressed during S-phase when it localizes to pericentric heterochromatin (PCH). In interphase, Esco2 depletion leads to a reduction in cohesin acetylation and Sororin recruitment to chromatin. In early mitosis, Esco2 deficiency causes changes in the chromosomal localization of cohesin and its protector Sgo1. Our results suggest that Esco2 is needed for cohesin acetylation in PCH and that this modification is required for the proper distribution of cohesin on mitotic chromosomes and for centromeric cohesion.


Conflict of interest statement

The authors declare that they have no conflict of interest

Figures

Figure 1
Figure 1
Deficiency in Esco2 leads to the termination of embryogenesis in the pre-implantation period. (A) Esco2 wild-type locus (I, II), targeted allele (III–V), conditional allele prior (III) and after (IV) removal of the Neo-PGK cassette and the mutant Esco2 allele (V) created by Cre-mediated recombination. LoxP and flp sites are marked by an empty or black triangle, respectively. (B) Southern blot of Esco2 alleles following PacI/PstI digestion. Targeting of the Esco2 locus leads to a loss of a PacI site. Lane 1: digested genomic DNA from mice homozygous for (IV), lane 2: digested genomic DNA from mice heterozygous for (II/IV), lane 3: digested genomic DNA from mouse embryonic fibroblasts homozygous for (V). Grey arrows in (A) depict the restriction fragments. (C) Esco2-deficient embryos die between the two- and eight-cell stage. With development, the number of Esco2-deficient but not of heterozygous embryos decreases. Esco2+/− parents were mated. (D) Anaphase of two-cell stage embryos. A lagging chromosome phenotype (empty arrowheads) correlated with Esco2 deficiency. Straight lines delineate the cell division plane; the solid circle, the zona pelucida; and dashed ellipses, the cells. (E) In prometaphase spreads, chromosomes of mutant embryos showed loss of centromeric constriction (arrowheads). PB is the polar body. Scale bars: 5 μm. Nocodazole-synchronized embryos in (D, E) derived from heterozygous timed matings.
Figure 2
Figure 2
Deficiency in Esco2 in cortical neuronal progenitors leads to apoptosis and complete agenesis of Esco2-deficient structures. (A) An adult Emx1-CRE;Esco2fl/fl mouse shows severe microcephaly apparent as a flattened forehead (black arrows). (B) A transverse section through the mutant forebrain shows severe agenesis of hippocampal and neocortical primordia. Scale bar: 300 μm. (C) Coronal Nissl-stained sections reveal agenesis of the hippocampus and of most of the neocortex. Scale bar: 100 μm. (D, E) Esco2 deficiency in cortical neuroepithelium results in increased accumulation of mitotic cells at the apical side. Scale bar: 20 μm. (F) Total number of mitotic cells in a stack of 40 serial sections through neocortex (NCx) and lateral ganglionic eminence (LGE) regions. Mutant NCx contains nearly two times as many mitotic cells as wild-type NCx. This increase was absent in the LGE that lacks the Cre-activity (***P<0.001, n=6). (G, H) Esco2-deficient neuronal progenitors undergo apoptosis (arrowheads), which takes place predominantly basally. Scale bar: 20 μm. H, hypothalamus; ha, hippocampal anlage; HPF, hippocampal formation; MZ, marginal zone; PIR, piriform cortex; PP, preplate; St, striatum; T, thalamus.
Figure 3
Figure 3
Esco2 is expressed during mid–late S-phase and localizes to PCH. (A) Confocal and STED microscopy detect Pcna and Esco2 in the nuclei of cortical neuronal progenitors. Columns 2–4 display mid S-phase nuclei characterized by patches of Pcna IF and an increase of Esco2 IF, which sharpens as the replication of PCH progresses (column 4) and results in typical Esco2 foci (arrowhead), surrounded by Pcna IF. Scale bars (AC): 3 μm. (B) A high-magnification STED image reveals that Esco2 localizes to PCH as identified by Hp1α staining (confocal image). (C) Localization of Esco2 to the PCH in MEFs. Arrows point to individual chromocentres magnified in the insets. In wild-type cells, Esco2 localizes to the PCH core surrounded by horseshoe-like structure labelled for Pcna (bottom row). Note that Esco2-deficient MEFs lack PCH-specific Esco2 IF (top row).
Figure 4
Figure 4
Chromatin immunoprecipitation reveals enrichment of Esco2 in the major satellite region and in other cohesin-bound loci located in chromosome arms. Chromatin from early and mid S-phase cells was immunoprecipitated with Esco2 antibody. Fold enrichment (relative to input) in wild-type and Esco2-deficient (control) MEFs in early and mid S-phase are shown. Since enrichment of cohesin and H3 trimethylK9 was indistinguishable in wild-type and Esco2-deficient MEFs, data are shown as single bar.
Figure 5
Figure 5
MEFsEsco2Δ/Δ show severe chromosome segregation defects. (A) Representative examples of chromosome segregation in MEFsEsco2Δ/Δ at different stages of mitosis. Images are organized in sequential order based on DNA stains and mitotic spindle morphology. Note lagging chromosomes (arrowheads), chromosomes prematurely advancing towards the spindle poles (empty arrowheads), chromosomal bridges (arrows). Scale bars (AE): 3 μm. (B) A MEFEsco2Δ/Δ cell with chromosomes asynchronously advancing to the spindle poles. CenpA IF reveals that paired sister chromatids are frequently left at the equator, while single chromatids have moved to the spindle poles. Insets show the boxed area at high magnification. (C) Chromosomal bridges in MEFsEsco2Δ/Δ appear as a thread of DNA located in between two poleward-moving chromosomal masses. These bridges are bounded by centromeric signals. (D) Lagging chromosomes contain a single centromere (inset). (E) After exit from mitosis MEFsEsco2Δ/Δ were characterized by DAPI-positive cytoplasmic bridges (arrows), micronuclei (arrowheads) and multilobulated nuclei (empty arrowheads). (F) Frequency of nuclear abnormalities are shown in (E). Quantification was performed in regular intervals after TB release (n>200 per genotype and time point).
Figure 6
Figure 6
Esco2 deficiency leads to the railroad track appearance of chromosomes and alters the distribution of cohesin, chromosomal passenger complex and Sgo1. (A) Examples of prometaphase chromosomes. The two top panels display control cells, which show either type 1 or type 2 chromosomes. In MEFsEsco2Δ/Δ predominantly chromosomes of types 3 and 4 (bottom panels) were observed. Insets show a high-power view of a typical chromosome. Scale bar: 10 μm. (B) Frequency of different chromosome types in control MEFs and MEFsEsco2Δ/Δ after 4 h of nocodazole arrest. 70% of MEFsEsco2Δ/Δ show railroad track appearance (n=200). (C) Esco2 deficiency leads to a delay in prometaphase/metaphase. Logarithmically grown cultures of immortalized MEFs were classified according to the DAPI stains into the different mitotic stages: A, anaphase; P, prophase; PM/M, prometaphase/metaphase; T, telophase. (D) Enrichment of cohesin at PCH is lost in prometaphase MEFsEsco2Δ/Δ. CREST IF was used to delineate the centromere. Insets show high-power views of centromeric regions of the chromosome boxed in white. Scale bar: 10 μm. (E) The frequency of prometaphase cells with cohesin enriched/not enriched at the centromeres (n=200). (F) Quantification of cohesin IF intensity at the PCH. Normalized to CREST signal intensity, MEFsEsco2Δ/Δ show a 60% reduction in cohesin signal relative to wild-type cells (n=200). (G) Localization of cohesin, Aurora B, Incenp and Sgo1 in prometaphase chromosomes. All four proteins show strong centromeric enrichment in control cells (right panel). In MEFsEsco2Δ/Δ, PCH enrichment of cohesin is lost but cohesin is seen in the arms as are Aurora B, Incenp and Sgo1 (left panel). Scale bar: 1 μm.
Figure 7
Figure 7
MEFsEsco2Δ/Δ are deficient in Smc3 acetylation and Sororin binding. (A) Western blots for the chromatin-bound fraction of Smc3 in control and MEFsEsco2Δ/Δ at different cell-cycle stages. Upper blot for each time point shows acetylated Smc3 while lower blot shows total Smc3. (B) Quantification of Smc3 acetylation levels in Esco2-depleted cells versus respective control samples as shown in (A). Values depict average of dilution series, error bars showing standard deviation. (C) IF of chromatin-bound proteins in cells depleted for Esco2 showing reduced Sororin signal throughout the nucleus. Scale bar: 5 μm. (D) Quantification of IF signals of Aurora B, Smc3 and Sororin in control and MEFsEsco2Δ/Δ in G2 at Aurora B positive chromocentres (left half) and outside of these (right half), showing an about 50% reduction in acetylation-dependent Sororin binding in both areas. (E) Chromatin immunoprecipitation of MEFsEsco2Δ/Δ reveals that Sororin binding to the major satellite (PCH) region is strongly reduced relative to control. Fold enrichment (relative to input) in G2 MEFs is shown. Note reduced Sororin binding at cohesin-bound locus in the arm of chromosome 11 (***P<0.01).

Similar articles

Cited by

References

    1. Ben-Shahar TR, Heeger S, Lehane C, East P, Flynn H, Skehel M, Uhlmann F (2008) Eco1-dependent cohesin acetylation during establishment of sister chromatid cohesion. Science 321: 563–566 - PubMed
    1. Bravo R, Macdonald-Bravo H (1987) Existence of two populations of cyclin/proliferating cell nuclear antigen during the cell cycle: association with DNA replication sites. J Cell Biol 105: 1549–1554 - PMC - PubMed
    1. Dorsett D (2007) Roles of the sister chromatid cohesion apparatus in gene expression, development, and human syndromes. Chromosoma 116: 1–13 - PMC - PubMed
    1. Gandhi R, Gillespie PJ, Hirano T (2006) Human Wapl is a cohesin-binding protein that promotes sister-chromatid resolution in mitotic prophase. Curr Biol 16: 2406–2417 - PMC - PubMed
    1. Gordillo M, Vega H, Trainer AH, Hou F, Sakai N, Luque R, Kayserili H, Basaran S, Skovby F, Hennekam RCM, Uzielli MLG, Schnur RE, Manouvrier S, Chang S, Blair E, Hurst JA, Forzano F, Meins M, Simola KOJ, Raas-Rothschild A et al. (2008) The molecular mechanism underlying Roberts syndrome involves loss of ESCO2 acetyltransferase activity. Hum Mol Genet 17: 2172–2180 - PubMed

Publication types

Substances