

Estimation of absolute protein quantities of unlabeled samples by selected reaction monitoring mass spectrometry
- PMID: 22101334
- PMCID: PMC3316728
- DOI: 10.1074/mcp.M111.013987
Estimation of absolute protein quantities of unlabeled samples by selected reaction monitoring mass spectrometry
Abstract
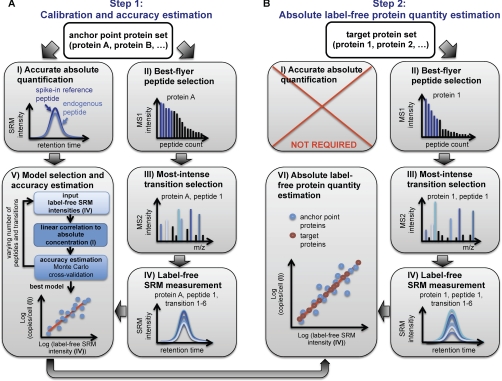
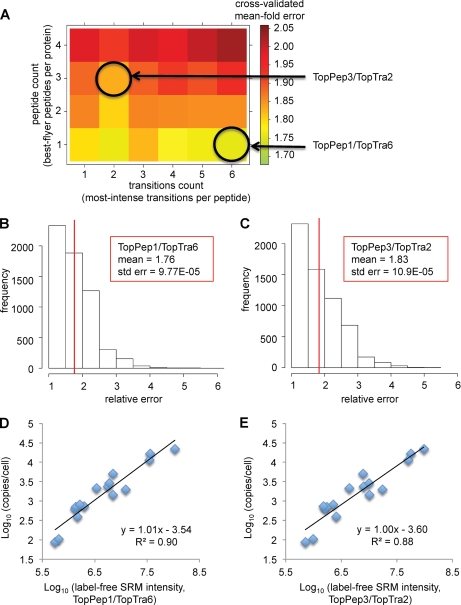
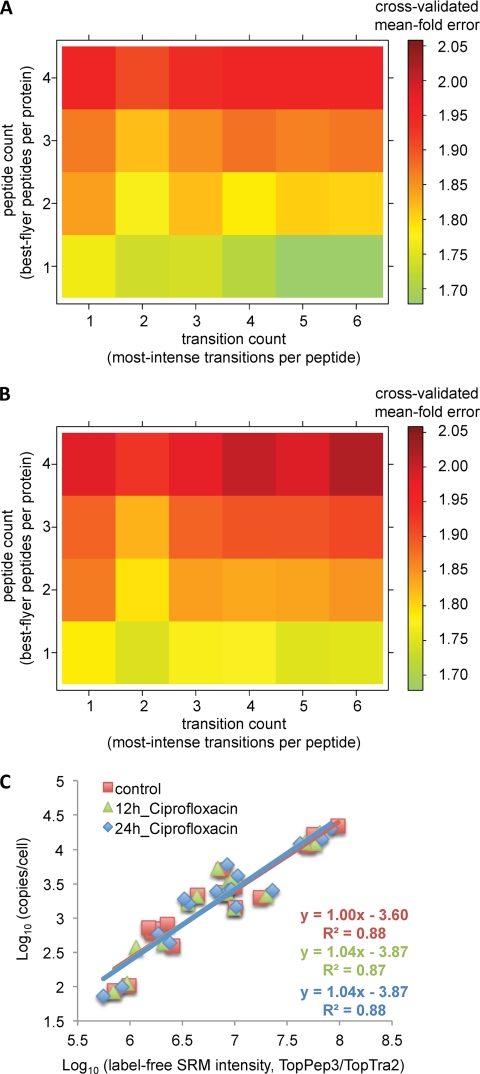
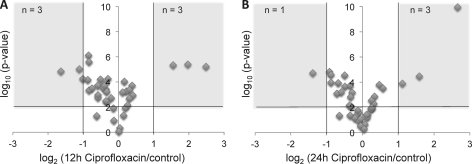
For many research questions in modern molecular and systems biology, information about absolute protein quantities is imperative. This information includes, for example, kinetic modeling of processes, protein turnover determinations, stoichiometric investigations of protein complexes, or quantitative comparisons of different proteins within one sample or across samples. To date, the vast majority of proteomic studies are limited to providing relative quantitative comparisons of protein levels between limited numbers of samples. Here we describe and demonstrate the utility of a targeting MS technique for the estimation of absolute protein abundance in unlabeled and nonfractionated cell lysates. The method is based on selected reaction monitoring (SRM) mass spectrometry and the "best flyer" hypothesis, which assumes that the specific MS signal intensity of the most intense tryptic peptides per protein is approximately constant throughout a whole proteome. SRM-targeted best flyer peptides were selected for each protein from the peptide precursor ion signal intensities from directed MS data. The most intense transitions per peptide were selected from full MS/MS scans of crude synthetic analogs. We used Monte Carlo cross-validation to systematically investigate the accuracy of the technique as a function of the number of measured best flyer peptides and the number of SRM transitions per peptide. We found that a linear model based on the two most intense transitions of the three best flying peptides per proteins (TopPep3/TopTra2) generated optimal results with a cross-correlated mean fold error of 1.8 and a squared Pearson coefficient R(2) of 0.88. Applying the optimized model to lysates of the microbe Leptospira interrogans, we detected significant protein abundance changes of 39 target proteins upon antibiotic treatment, which correlate well with literature values. The described method is generally applicable and exploits the inherent performance advantages of SRM, such as high sensitivity, selectivity, reproducibility, and dynamic range, and estimates absolute protein concentrations of selected proteins at minimized costs.
Figures
References
-
- de Godoy L. M., Olsen J. V., Cox J., Nielsen M. L., Hubner N. C., Fröhlich F., Walther T. C., Mann M. (2008) Comprehensive mass-spectrometry-based proteome quantification of haploid versus diploid yeast. Nature 455, 1251–1254 - PubMed
-
- Krijgsveld J., Ketting R. F., Mahmoudi T., Johansen J., Artal-Sanz M., Verrijzer C. P., Plasterk R. H., Heck A. J. (2003) Metabolic labeling of C. elegans and D. melanogaster for quantitative proteomics. Nat. Biotechnol. 21, 927–931 - PubMed
-
- Faca V. M., Song K. S., Wang H., Zhang Q., Krasnoselsky A. L., Newcomb L. F., Plentz R. R., Gurumurthy S., Redston M. S., Pitteri S. J., Pereira-Faca S. R., Ireton R. C., Katayama H., Glukhova V., Phanstiel D., Brenner D. E., Anderson M. A., Misek D., Scholler N., Urban N. D., Barnett M. J., Edelstein C., Goodman G. E., Thornquist M. D., McIntosh M. W., DePinho R. A., Bardeesy N., Hanash S. M. (2008) A mouse to human search for plasma proteome changes associated with pancreatic tumor development. PLoS Med. 5, e123. - PMC - PubMed
-
- Olsen J. V., Vermeulen M., Santamaria A., Kumar C., Miller M. L., Jensen L. J., Gnad F., Cox J., Jensen T. S., Nigg E. A., Brunak S., Mann M. (2010) Quantitative phosphoproteomics reveals widespread full phosphorylation site occupancy during mitosis. Sci Signal. 3, ra3. - PubMed
Publication types
MeSH terms
Substances
LinkOut - more resources
Full Text Sources
Other Literature Sources
Molecular Biology Databases
