. 2012 Feb;25(2):246-59.
doi: 10.1038/modpathol.2011.164. Epub 2011 Nov 18.

Phenotypic complexity of T regulatory subsets in patients with B-chronic lymphocytic leukemia

Affiliations

Phenotypic complexity of T regulatory subsets in patients with B-chronic lymphocytic leukemia

Angélique Biancotto et al. Mod Pathol. 2012 Feb.

Abstract

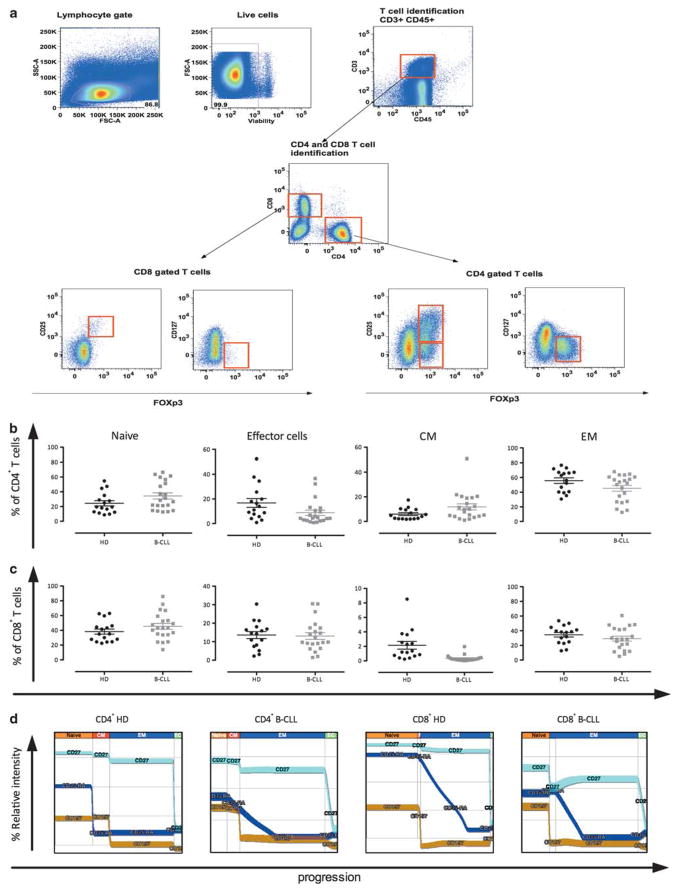
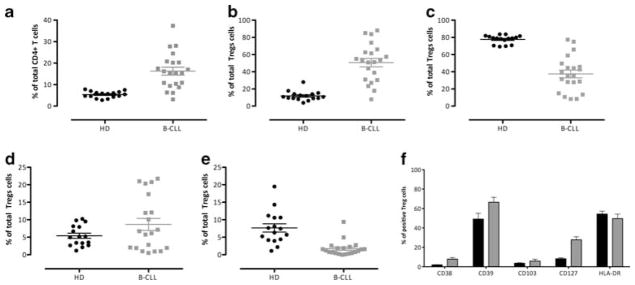
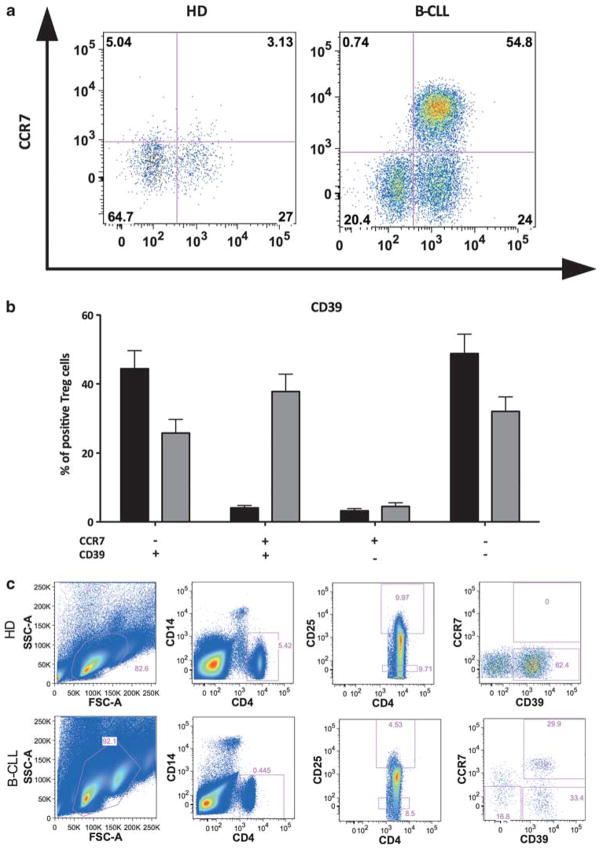
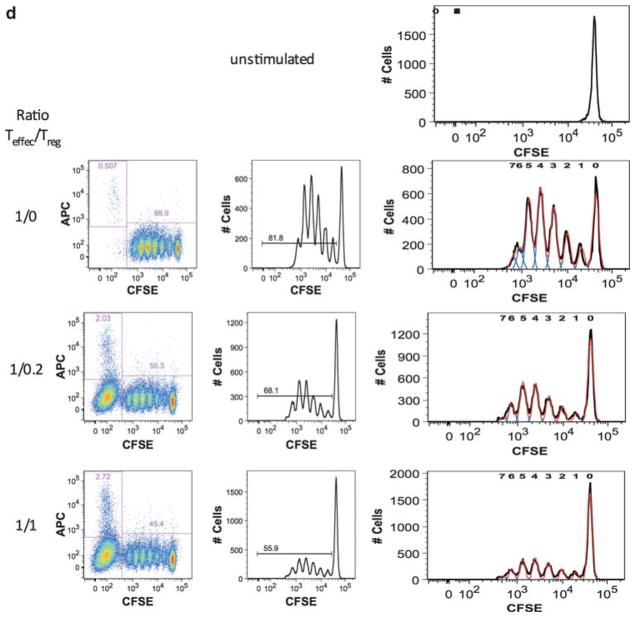
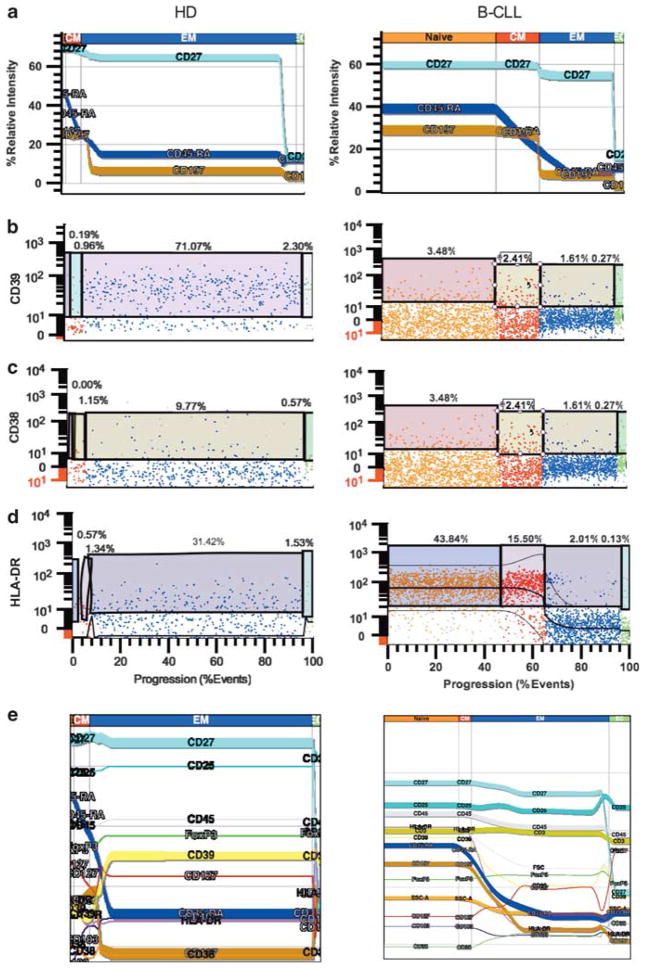
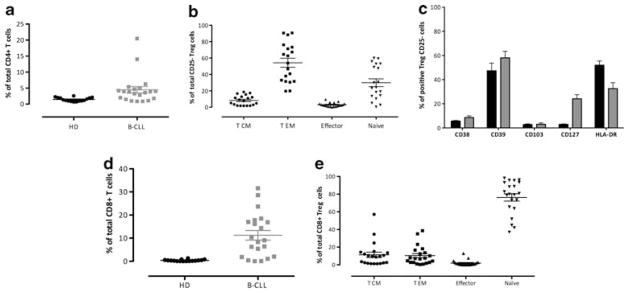
Increased numbers of T regulatory (T(reg)) cells are found in B-chronic lymphocytic leukemia, but the nature and function of these T(regs) remains unclear. Detailed characterization of the T(regs) in chronic lymphocytic leukemia has not been performed and the degree of heterogeneity of among these cells has not been studied to date. Using 15-color flow cytometry we show that T(reg) cells, defined using CD4, CD25, and forkhead box P3 (FOXP3), can be divided into multiple complex subsets based on markers used for naïve, memory, and effector delineation as well as markers of T(reg) activation. Furthermore FOXP3(+) cells can be identified among CD4(+)CD25(-) as well as CD8(+)CD4(-) populations in increased proportions in patients with chronic lymphocytic leukemia compared with healthy donors. Significantly different frequencies of naïve and effector T(regs) populations are found in healthy donor controls compared with donors with chronic lymphocytic leukemia. A population of CCR7(+)CD39(+) T(regs) was significantly associated with chronic lymphocytic leukemia. This population demonstrated slightly reduced suppressive activity compared with total T(regs) or T(regs) of healthy donors. These data suggest that FOXP3-expressing cells, particularly in patients with chronic lymphocytic leukemia are much more complex for T(reg) sub-populations and transitions than previously reported. These findings demonstrate the complexity of regulation of T-cell responses in chronic lymphocytic leukemia and illustrate the use of high-dimensional analysis of cellular phenotypes in facilitating understanding of the intricacies of cellular immune responses and their dysregulation in cancer.


Conflict of interest statement

Disclosure/conflict of interest

The authors declare no conflict of interest.

Figures

Figure 1
Figure 1
Gating strategy to identify T regulatory (Tregs) population in chronic lymphocytic leukemia patients and CD4 and CD8 characterization. Single-cell suspensions from chronic lymphocytic leukemia were stained with a combination of 14 antibodies and a viable dye as described in Materials and methods. (a) Lymphocytes were identified based on their forward- and side-scatter properties. Subsequently, dead cells were excluded through the use of a viability dye. CD45 and CD3 were used to identify T cells (CD45+CD3+) among the previously selected viable lymphocytes. CD4 T cells and CD8 T cells were identified as uniquely expressing CD4 or CD8 antigens. Conventional Tregs were defined as CD4 T cells co-expressing CD25 and transcription factor forkhead box P3 (FOXP3). CD127 expression was measured in FOXP3-expressing cells. CD25 Tregs were defined as CD4+FOXP3+CD25 T cells. CD8 Tregs were defined as CD8+CD25+FOXP3+ T cells. In addition to Tregs memory and naïve compartment of CD4 and CD8 was described. The graphs display the percentages (the mean percentage values±s.e.m. are indicated by the bars) of naïve vs memory sub-population CD4 Tcells (b) and CD8 T cells (c) in healthy donors (black circle) and chronic lymphocytic leukemia (gray square). (d) A probability state model constructed with GemStone (Verity Software House) was applied to CD4 T cells and CD8 T cells from healthy donors and from chronic lymphocytic leukemia. For these displays, the data were gated on light scatter, viability, and expression of CD45, CD3, and either CD4 or CD8 as described earlier. The y-axis is relative fluorescence intensity, whereas the x-axis displays staged progression from naïve to memory (CM, EM) and effector (EC) compartments. The width of each stage (naïve, EM, CM, EC) indicates the percentage of cells falling into these categories. The width of the bands corresponds to the variability of the data as the cells progress. These graphs reveal the same proportions of memory and naïve subsets as in the previous figures, although here it is possible to visualize relative intensity of marker expression along with putative transitions among these populations.
Figure 2
Figure 2
Conventional Tregulatory (Tregs), memory vs naïve subtypes and expression of activation markers in healthy donors and chronic lymphocytic leukemia. Cells were stained as described in Materials and methods and analysis was performed to identify conventional Tregs. (a) Percentages and the mean percentage values (±s.e.m.) of CD4 Tregs in healthy donors (black) and chronic lymphocytic leukemia (gray). (b) Percentages and the mean percentage values (±s.e.m.) of naïve Tregs in healthy donors (black) and chronic lymphocytic leukemia (gray) identified as CD45RA+ cells among Tregs. (c) Percentages and the mean percentage values (±s.e.m.) of effector memory (EM) Tregs identified as CD27+CCR7 cells among Tregs in healthy donors (black) and chronic lymphocytic leukemia (gray). (d) Percentages and the mean percentage values (±s.e.m.) of central memory (CM) Tregs identified as CD27+CCR7+ cells among Tregs in healthy donors (black) and chronic lymphocytic leukemia (gray). (e) Percentages and the mean percentage values (±s.e.m.) of effector Tregs identified as CD27CCR7 cells among Tregs in healthy donors (black) and chronic lymphocytic leukemia (gray). (f) Percentages and the mean percentage values (±s.e.m.) of Tregs expressing activation markers CD38, CD39, CD103, CD127, and HLA-DR were measured in healthy donors (black) and chronic lymphocytic leukemia (gray).
Figure 3
Figure 3
Co-expression of CD39 and CCR7 in conventional T regulatory (Tregs) in healthy donors and chronic lymphocytic leukemia and autologous Treg-mediated suppression of polyclonal T-cell responses from healthy donors and chronic lymphocytic leukemia. Conventional Tregs were identified after staining as described earlier. Expression of the activation markers CD39 and CCR7 were measured. (a) Representative dot plot of CD39 and CCR7 co-expression pattern on conventional Tregs in a healthy donor (left panel) and chronic lymphocytic leukemia (right panel). (b) Histograms of the mean percentages (±s.e.m.) of Tregs expressing these markers in healthy donors (black) and chronic lymphocytic leukemia (gray). (c) Tregs were isolated using flow cytometric sorting as described earlier. Expression of CD25 and CD4 were used to identify Treg cells in both healthy donors and in chronic lymphocytic leukemia. A representative dot plot of CD39 and CCR7 expression pattern in a healthy donor (upper panel) and chronic lymphocytic leukemia (lower panel). (d) Suppressive capacity of Tregs toward responder cells (Teffec) was expressed as relative inhibition of the percentage of CSFE-low cells.
Figure 3
Figure 3
Co-expression of CD39 and CCR7 in conventional T regulatory (Tregs) in healthy donors and chronic lymphocytic leukemia and autologous Treg-mediated suppression of polyclonal T-cell responses from healthy donors and chronic lymphocytic leukemia. Conventional Tregs were identified after staining as described earlier. Expression of the activation markers CD39 and CCR7 were measured. (a) Representative dot plot of CD39 and CCR7 co-expression pattern on conventional Tregs in a healthy donor (left panel) and chronic lymphocytic leukemia (right panel). (b) Histograms of the mean percentages (±s.e.m.) of Tregs expressing these markers in healthy donors (black) and chronic lymphocytic leukemia (gray). (c) Tregs were isolated using flow cytometric sorting as described earlier. Expression of CD25 and CD4 were used to identify Treg cells in both healthy donors and in chronic lymphocytic leukemia. A representative dot plot of CD39 and CCR7 expression pattern in a healthy donor (upper panel) and chronic lymphocytic leukemia (lower panel). (d) Suppressive capacity of Tregs toward responder cells (Teffec) was expressed as relative inhibition of the percentage of CSFE-low cells.
Figure 4
Figure 4
Probability state modeling of T regulatory (Treg) populations in healthy donors and chronic lymphocytic leukemia. Probability model of activation markers expression in conventional Tregs in a healthy donor (left panel) and chronic lymphocytic leukemia (right panel). For these models, the data were gated on light scatter, viability, and expression of CD45, CD3, CD4, CD25high, and FOXP3 as described earlier. The y-axis is relative fluorescence intensity, whereas the x-axis displays staged progression from naïve to memory and effector populations. The width of each stage (naïve, CM, EM, EC) indicates the percentage of cells falling into these categories. The width of the bands corresponds to the variability of the data as the cells progress. These graphs reveal the coordinate expression patterns of memory and naïve markers (a) as well as activation markers through the transitions (b, c and d). Panel e reveals the expression of all markers among the conventional Treg cells in a coordinated manner, with intensities of all markers revealed through the transitional steps.
Figure 5
Figure 5
CD4+CD25Tregs and CD8 Tregs, their memory vs naïve subtypes, and their activation status in healthy donors and chronic lymphocytic leukemia. Cells were stained with antibodies and analysis was performed to identify CD25Tregs and CD8 Tregs as described earlier. (a) The graphs display the percentages and the mean percentage values (±s.e.m.) of CD25Tregs in healthy donors (black) and chronic lymphocytic leukemia (gray). (b) The graphs show the percentages and the mean percentage values (±s.e.m.) of central memory (CM) CD25Tregs (identified as CD27+CCR7+ cells among CD45RACD25Tregs), of effector memory (EM) CD25Tregs (identified as CD27+ CCR7 cells among CD45RACD25Tregs), of effector CD25Tregs (identified as CD27CCR7 cells among CD45RACD25Tregs), and naïve CD25Tregs (identified as cells among CD25Tregs). (c) The graphs display the mean percentage values (±s.e.m.) of CD25Tregs expressing activation markers CD38, CD39, CD103, CD127, and HLA-DR in healthy donors (black) and chronic lymphocytic leukemia (gray). (d) The graphs represent the percentages and the lines indicate the mean percentage value (±s.e.m.) of CD8 Tregs in healthy donors (black) and chronic lymphocytic leukemia (gray). (e) The graphs show the percentages and the lines indicate the mean percentage value (±s.e.m.) of CM CD8 Tregs (identified as CD27+CCR7+ cells among CD45RACD8 Tregs), of effector memory (EM) CD8 Tregs (identified as CD27+CCR7 cells among CD45RACD8 Tregs), of effector CD8 Tregs (identified as CD27CCR7 cells among CD45RACD8 Tregs), and naïve CD8 Tregs (identified as CD45RA+ cells among CD8 Tregs).

References

    1. Scrivener S, Goddard RV, Kaminski ER, Prentice AG. Abnormal T-cell function in B-cell chronic lymphocytic leukaemia. Leuk Lymphoma. 2003;44:383–389. - PubMed
    1. Reyes E, Prieto A, Carrion F, et al. Altered pattern of cytokine production by peripheral blood CD2+ cells from B chronic lymphocytic leukemia patients. Am J Hematol. 1998;57:93–100. - PubMed
    1. Dianzani U, Omede P, Marmont F, et al. Expansion of T cells expressing low CD4 or CD8 levels in B-cell chronic lymphocytic leukemia: correlation with disease status and neoplastic phenotype. Blood. 1994;83:2198–2205. - PubMed
    1. Mackus WJ, Frakking FN, Grummels A, et al. Expansion of CMV-specific CD8+CD45RA+CD27− T cells in B-cell chronic lymphocytic leukemia. Blood. 2003;102:1057–1063. - PubMed
    1. Beyer M, Kochanek M, Darabi K, et al. Reduced frequencies and suppressive function of CD4+CD25hi regulatory T cells in patients with chronic lymphocytic leukemia after therapy with fludarabine. Blood. 2005;106:2018–2025. - PubMed

Publication types