. 2011 Dec;110(2):123-37.
doi: 10.1007/s11120-011-9709-2. Epub 2011 Nov 20.

Photoacclimation in Dunaliella tertiolecta reveals a unique NPQ pattern upon exposure to irradiance

Affiliations

Photoacclimation in Dunaliella tertiolecta reveals a unique NPQ pattern upon exposure to irradiance

Sven Ihnken et al. Photosynth Res. 2011 Dec.

Abstract

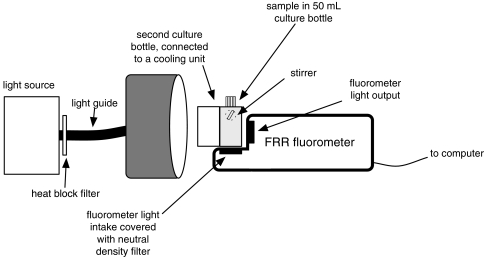
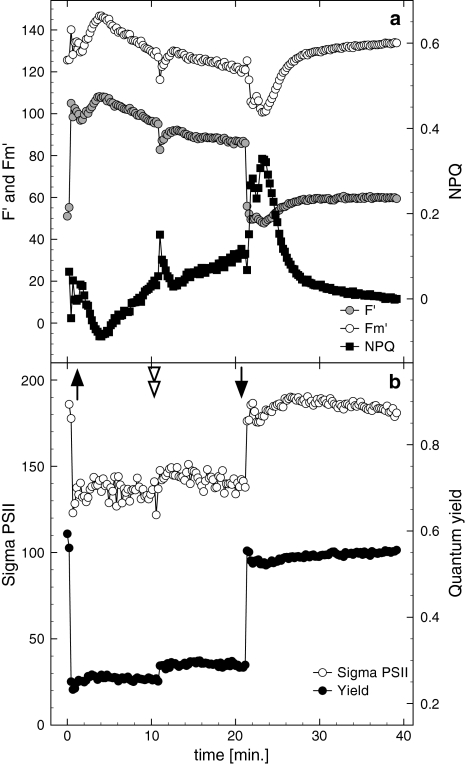
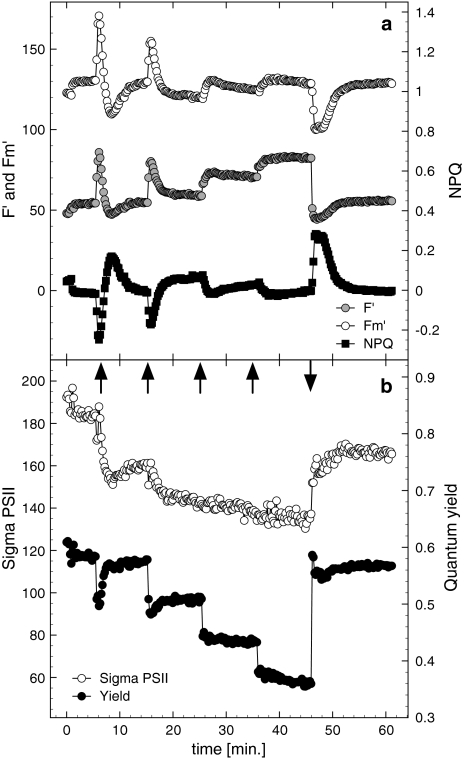
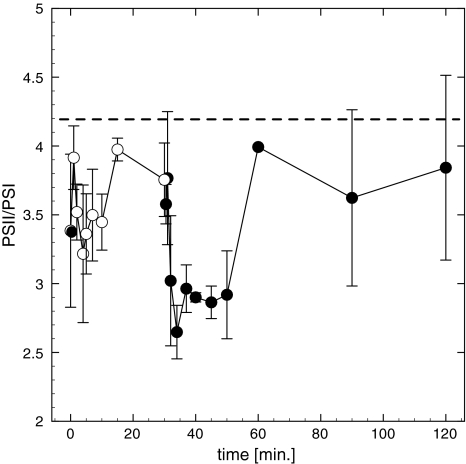
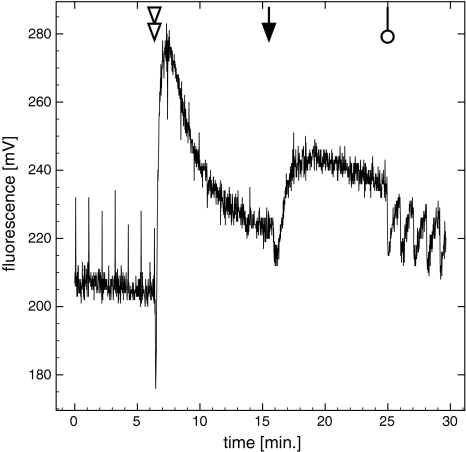
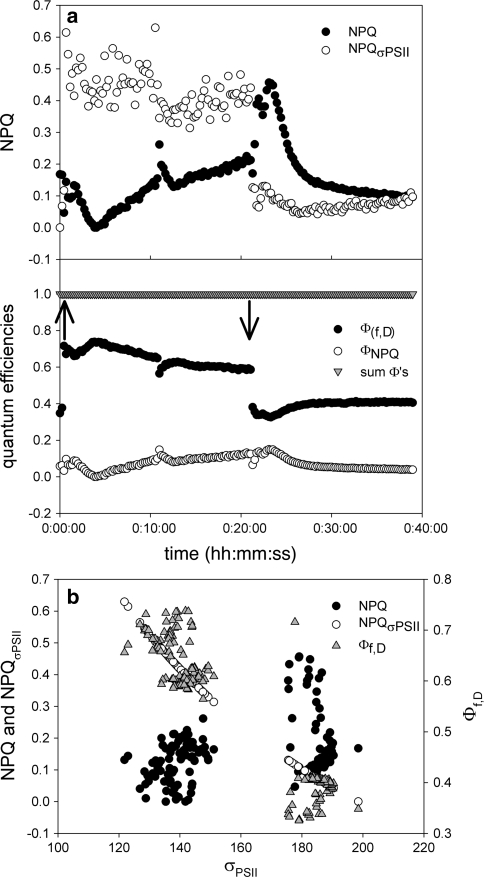
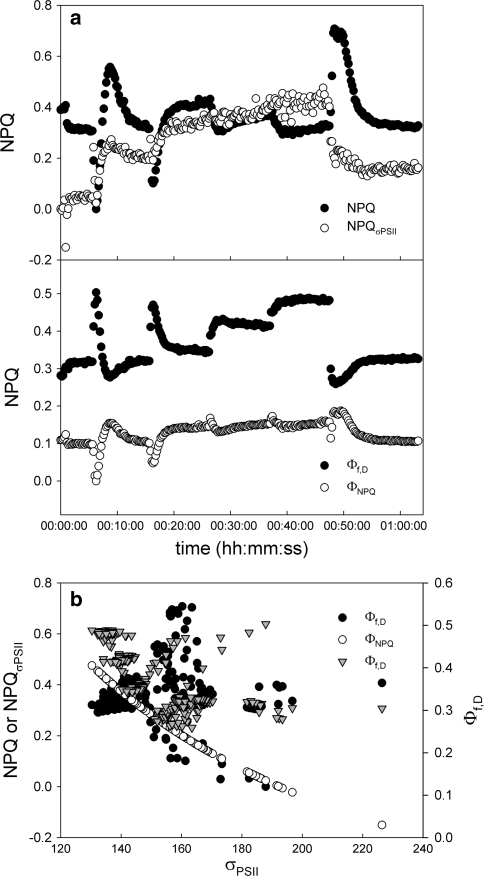
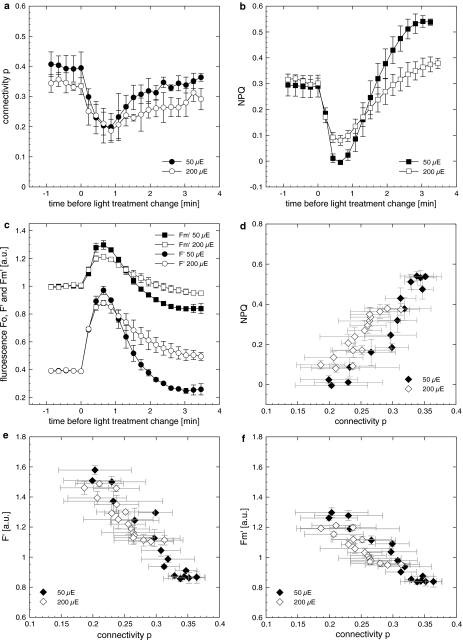
Highly time-resolved photoacclimation patterns of the chlorophyte microalga Dunaliella tertiolecta during exposure to an off-on-off (block) light pattern of saturating photon flux, and to a regime of consecutive increasing light intensities are presented. Non-photochemical quenching (NPQ) mechanisms unexpectedly responded with an initial decrease during dark-light transitions. NPQ values started to rise after light exposure of approximately 4 min. State-transitions, measured as a change of PSII:PSI fluorescence emission at 77 K, did not contribute to early NPQ oscillations. Addition of the uncoupler CCCP, however, caused a rapid increase in fluorescence and showed the significance of qE for NPQ. Partitioning of the quantum efficiencies showed that constitutive NPQ was (a) higher than qE-driven NPQ and (b) responded to light treatment within seconds, suggesting an active role of constitutive NPQ in variable energy dissipation, although it is thought to contribute statically to NPQ. The PSII connectivity parameter p correlated well with F', F(m)' and NPQ during the early phase of the dark-light transients in sub-saturating light, suggesting a plastic energy distribution pattern within energetically connected PSII centres. In consecutive increasing photon flux experiments, correlations were weaker during the second light increment. Changes in connectivity can present an early photoresponse that are reflected in fluorescence signals and NPQ and might be responsive to the short-term acclimation state, and/or to the actinic photon flux.


Figures

Fig. 1
Fig. 1
Schematic drawing of the FRRF experimental set-up. A 50-ml culture bottle contained the samples and was placed against the FRR fluorometer so that it received the flashlet sequences from behind (fluorometer light output), and the actinic light the front (i.e. the left side in this drawing). The photomultiplier detected chlorophyll fluorescence from below. Due to relatively high cell densities, neutral density filters shielded the light intake to avoid overload of the photomultiplier. A translucent cooling jacket was placed against the front of the sample to avoid rising temperatures due to heat emission from the actinic (halogen) light source. The sample was stirred with the stirrer placed at the side of the culture bottle
Fig. 2
Fig. 2
Representative fluorescence parameters measured by FRRF during a dark to light transition using a single irradiance intensity (‘block light treatment’) and darkness. a F′, F m′ on the primary ordinate, and NPQ on the secondary Y-axis; b σPSII (Sigma PSII) and maximal quantum yields as well as effective quantum yields during the irradiance treatment. The upward arrow indicates the start of the light period using a photon flux of 440 μmol photons m−2 s−1 (approx. 4 × growth light intensity) after dark incubation (1–2 h). The downward arrow indicates the end of the light treatment. An addition of 160 μM dissolved inorganic carbon aimed for detection of nutrient depletion (double arrowhead), which should not have occurred due to low cell densities in this experiment. Results were confirmed in two independent experiments
Fig. 3
Fig. 3
Representative fluorescence parameters measured by FRRF during consecutive increasing photon flux treatments (dark–light transient and following increases in photon flux, indicated by upward arrows) and darkness (downward arrow). a F′, F m′ on the primary ordinate, and NPQ on the secondary Y-axis; b σPSII (Sigma PSII) and maximal quantum yields as well as effective quantum yield during the irradiance treatment. Photon fluxes were 50, 200, 340 and 470 μmol photons m−2 s−1. Results were confirmed in two independent experiments
Fig. 4
Fig. 4
Representative fluorescence emission spectrum measured at 77 K (a) and residuals remaining after de-convolution (b). A minimum of three measurements per sample were averaged and baseline corrected. The fit was forced through peaks at 685 nm (light harvesting compounds of PSII), 695 nm (PSII reaction core), 702 nm (origin not clear), 715 nm (PSI) and 730 nm (PSI, or vibration). Top curve: dots data points, line resulting fit from de-convolution. Although the origin of the F 702 is obscure, leaving it out resulted in poor fits. Spectra were normalised to F 658 nm. Residuals (b) show the quality of the fit and remained below 0.05 for all samples analysed. Emission peak height data were used for PSII/PSI ratio (F 685/F 715 nm). Excitation wavelength was 435 nm
Fig. 5
Fig. 5
Low-temperature PSII/PSI fluorescence emission ratios (F 685/F 715 nm). Samples were collected during block light treatment of 660 μmol photons m−2 s−1 (open circles) and darkness (closed circles). Dark acclimation was 1 h prior to illumination. Far-red light treatment for 15 min after 1 h darkness showed highest values (dashed line). Data represent mean of three independent measurements (±SD). Considerable higher cell densities than during FRRF measurements were required for analysis in this experiment. To account for package effects of the denser medium, photon flux was elevated compared to experiments where FRRF measurements were taken
Fig. 6
Fig. 6
Continuous fluorescence at room temperature using a Diving-PAM. Data show one representative fluorescence trace during block light treatment of 660 μmol photons m−2 s−1 and darkness (downward arrow). Cells were poisoned with 200 μM CCCP (double arrowhead) after a light acclimated state was established. CCCP is a protonophore that dissipated the ∆pH gradient and relaxes energy-dependent quenching, but also prohibits photosynthesis. The open circle indicates the resumption of the saturation pulse train, which was interrupted prior to the light–dark transition. The oscillations might be caused by static interactions (see Vredenberg 2008)
Fig. 7
Fig. 7
Analysis of quenching yields subjected to a block light treatment (data Fig. 2). a Top panel NPQ calculated using the Stern–Volmer equation ((F m − F m′)/F m′), and as formula image ((σPSII − σPSII′)/σPSII′). Bottom panel regulated NPQ (ΦNPQ) and constitutive NPQ plus fluorescence (Φf,D) and the sum of all quantum efficiencies (ΦNPQ + Φf,D + ∆F/F m′). b Relationship between σPSII (bottom X-axis) and the two proxies for the NPQ (left Y-axis) or the quantum efficiency for constitutive NPQ (right Y-axis). As can be seen there is an excellent relationship between changes in σPSII and Φf,D, but not between changes in σPSII and changes in the “classical” NPQ
Fig. 8
Fig. 8
Analysis of quenching yields subjected to a stepwise increase in irradiance (data Fig. 3). a Top panel NPQ calculated using the Stern–Volmer equation ((F m − F m′)/F m′), and as formula image ((σPSII − σPSII′)/σPSII′). Bottom panel regulated NPQ (ΦNPQ) and constitutive NPQ (Φf,D). b Relationship between σPSII (bottom X-axis) and the two proxies for the NPQ (left Y-axis) or the quantum efficiency for constitutive NPQ (right Y-axis)
Fig. 9
Fig. 9
Connectivity p (a), NPQ calculated using the Stern–Volmer equation ((F m − F m′)/F m′) (b) and F’, F m′ (c) during the first minutes of the dark–light transition and the following higher irradiance treatment. Data were extracted from Fig. 3 (i.e. the experiment, where cells were exposed to consecutive increasing photon fluxes) and rearranged for better comparison. Filled symbols show the first light treatment, open symbols the following irradiance step. Numbers in the legends refer to the photon flux [closed symbols (50 μE) = 50 μmol photons m−2 s−1; open symbols (200 μE) = 200 μmol photons m−2 s−1]. Please note that data from the first and second light increment are plotted on the same timeline for improved comparability. d A positive correlation between NPQ and p, while correlations were negative for F′ (e) and F m′ (f). F′ and F m′ in (e, f) have also been normalised to values prior to light treatment. Changes on the Y-axis therefore depict the relative change of F′ and F m′, which explains why F′ values can be higher F m′. Correlation coefficients were stronger (r 2 ≥ 0.88) in cells exposed to the first light increment (closed symbols) compared to the higher irradiance in the second light step (open symbols, r 2 ≤ 0.61). For readability reasons F′ has been normalised to 0.4 and not 1 in (c). Data show mean and SD (n = 3)

Similar articles

Cited by

References

    1. Adams WW, Demmig-Adams B. The xanthophyll cycle and sustained thermal energy dissipation activity in Vinca minor and Euonymus kiaufschovicus in winter. Plant Cell Environ. 1995;18(2):117–127.
    1. Adams WW, Demming-Adams B, Verhoeven AS, Barker D. Photoinhibition during winter stress-involvement of sustained xanthophyll cycle-dependent energy dissipation. Aust J Plant Physiol. 1995;22:261–276.
    1. Ahn TK, Avenson TJ, Peers G, Li Z, Dall’osto L, Bassi R, Niyogi KK, Fleming GR. Investigating energy partitioning during photosynthesis using an expanded quantum yield convention. Chem Phys. 2009;357(13):151–158.
    1. Allen J, Pfannschmidt T. Balancing the two photosystems: photosynthetic electron transfer governs transcription of reaction centre genes in chloroplasts. Philos Trans R Soc Lond B. 2000;355(1402):1351–1357. - PMC - PubMed
    1. Campbell W, Ogren W. Electron transport through photosystem-I stimulates light activation of ribulose bisphosphate carboxylase oxygenase (Rubisco) by Rubisco activase. Plant Physiol. 1990;94(2):479–484. - PMC - PubMed

Publication types

MeSH terms

Substances

LinkOut - more resources