. 2011 Dec;84(1008):1067-82.
doi: 10.1259/bjr/74368403.

Review. The Agfa Mayneord lecture: MRI of short and ultrashort T₂ and T₂* components of tissues, fluids and materials using clinical systems

Affiliations

Review. The Agfa Mayneord lecture: MRI of short and ultrashort T₂ and T₂* components of tissues, fluids and materials using clinical systems

G M Bydder. Br J Radiol. 2011 Dec.

Abstract

A variety of techniques are now available to directly or indirectly detect signal from tissues, fluids and materials that have short, ultrashort or supershort T₂ or T₂* components. There are also methods of developing image contrast between tissues and fluids in the short T₂ or T₂* range that can provide visualisation of anatomy, which has not been previously seen with MRI. Magnetisation transfer methods can now be applied to previously invisible tissues, providing indirect access to supershort T₂ components. Particular methods have been developed to target susceptibility effects and quantify them after correcting for anatomical distortion. Specific methods have also been developed to image the effects of magnetic iron oxide particles with positive contrast. Major advances have been made in techniques designed to correct for loss of signal and gross image distortion near metal. These methods are likely to substantially increase the range of application for MRI.


Figures

Figure 1
Figure 1
Ultrashort echo time subtraction MRI of the skull. The inner and outer tables are seen in a manner similar to X-ray computed tomography displayed with bone windows.
Figure 2
Figure 2
(a) Transverse magnitude and (b) phase images of the forearm with a ultrasound echo time (TE; −12 μs) sequence. Differences in phase are seen between the cortical bone of the radius and ulnar (arrows) and the surrounding soft tissues, as well as between muscle and tendon in (b).
Figure 3
Figure 3
Sagittal short echo time image of the Achilles tendon. Oblique fibres at the magic angle are seen within the tendon (white arrows). Fibrocartilage of the tendon enthesis is also seen as a high-signal area (black arrow).
Figure 4
Figure 4
(a) Diagram of the fibre structure of the meniscus from Petersen and Tillmann [172] (with permission), and (b) short echo time image of the meniscus. In (a) a very thin (30 nm) layer is shown (1) with the lamella (2) and circumferential fibres (3). In (b) layer (1) is not seen, but the external lamella fibres are seen as high-signal on the surface of the meniscus and extensive radial fibres are seen within the meniscus.
Figure 5
Figure 5
(a) Longitudinal and (b) transverse short echo time images of the root ligament of the meniscus. Linear high-signal endoligament and fine transverse fibres are seen in (a). High-signal endoligament extending across the ligament is seen in (b).
Figure 6
Figure 6
Sagittal short echo time image of the temporomandibular disc at different relations to B0 (arrows). The intermediate zone is low-signal in the upper image with anteroposterior and lamella fibres parallel to B0, and high-signal when these fibres are at the magic angle (lower image).
Figure 7
Figure 7
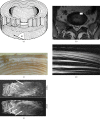
(a) Diagram of the annulus of the intervertebral disc from Bogduk [173] (with permission), (b) axial image of the L5/S1 disc, (c) photograph of a segment of an annulus of the disc, (d) the corresponding fibre structure seen with a short echo time (TE) sequence and (e) oblique coronal views of adjacent lamella. The lamella structure of the disc is shown in (a) with alternating layers of fibres at angle θ to the plane of the disc. An L5/S1 disc is shown in (b) with the white rectangle showing a section of the annulus as seen in (c). A short TE image (d) shows high signal from some lamellae and extracellular matrix, and low signal from other lamellae, following a generally alternating pattern. (e) Arrows show the fibre directions in alternate lamella at θ = 25° to the plane of the disc.
Figure 8
Figure 8
(a) Conventional short tau inversion recovery (STIR) image of a prosthesis of the right hip and (b) slice encoding for metal artefact correction STIR image of the same region. The bone marrow of the acetabulum shows an increased signal in (b) (arrow). This area is not seen in (a).

References

    1. Spiers FW. William Valentine Mayneord. Biogr Mems Fell R Soc 1991;37:343–64
    1. Lamerton LF. Obituary Professor W V Mayneord CBE, DSc, FInstP, FRS. Br J Radiol 1988;61:1093–4 - PubMed
    1. Mayneord WV. Physics in medicine. Br Med Bull 1945;3:129–32
    1. Young IR, Khenia S, Thomas DG, Davis CH, Gadian DG, Cox IJ, et al. Clinical magnetic susceptibility mapping of the brain. J Comput Assist Tomogr 1987;11:2–6 - PubMed
    1. Haacke EM, Reichenbach JR, (eds). Susceptibility weighted imaging in MRI: basic concepts and clinical applications. Hoboken, NJ: Wiley-Blackwell, 2011

Publication types

MeSH terms