. 2011 Nov 20;15(1):146-54.
doi: 10.1038/nn.2983.

Neural correlates of reliability-based cue weighting during multisensory integration

Affiliations

Neural correlates of reliability-based cue weighting during multisensory integration

Christopher R Fetsch et al. Nat Neurosci. .

Abstract

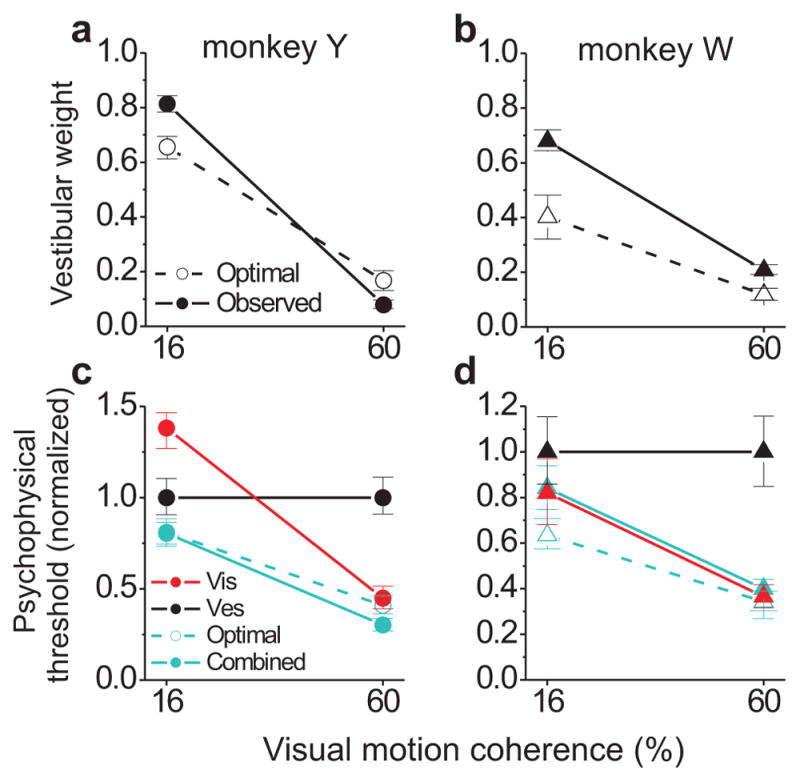
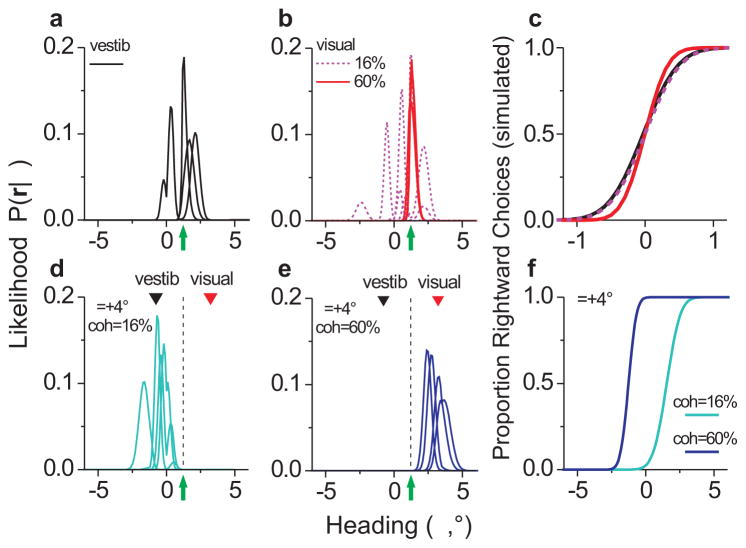
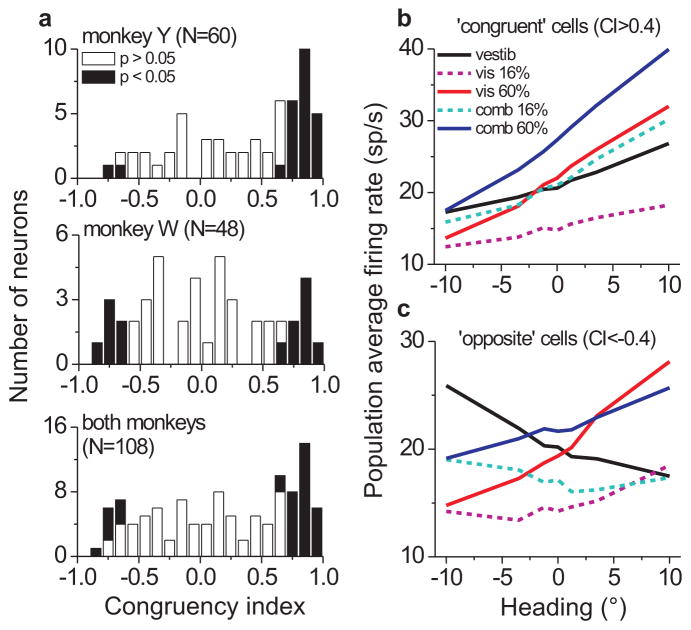
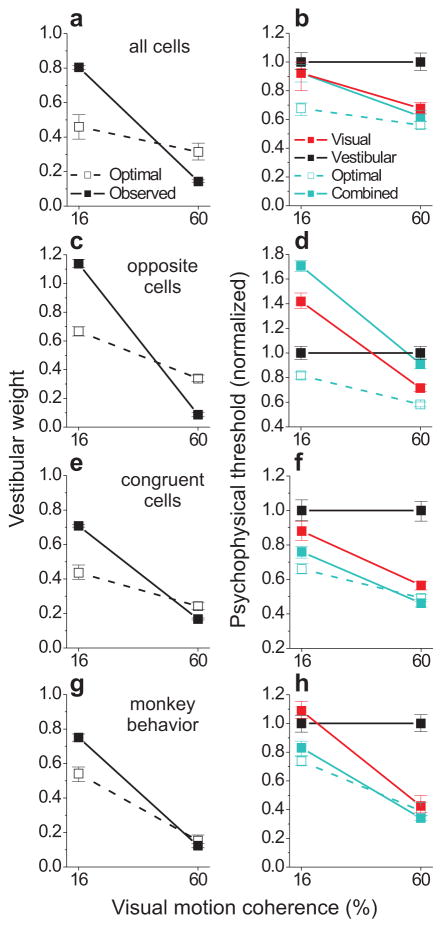
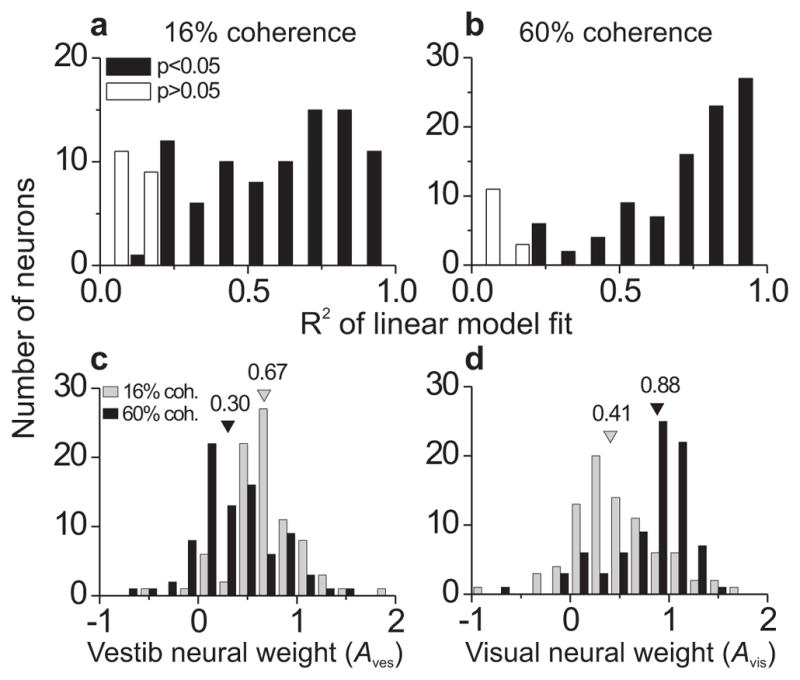
Integration of multiple sensory cues is essential for precise and accurate perception and behavioral performance, yet the reliability of sensory signals can vary across modalities and viewing conditions. Human observers typically employ the optimal strategy of weighting each cue in proportion to its reliability, but the neural basis of this computation remains poorly understood. We trained monkeys to perform a heading discrimination task from visual and vestibular cues, varying cue reliability randomly. The monkeys appropriately placed greater weight on the more reliable cue, and population decoding of neural responses in the dorsal medial superior temporal area closely predicted behavioral cue weighting, including modest deviations from optimality. We found that the mathematical combination of visual and vestibular inputs by single neurons is generally consistent with recent theories of optimal probabilistic computation in neural circuits. These results provide direct evidence for a neural mechanism mediating a simple and widespread form of statistical inference.


Figures

Figure 1
Figure 1
Cue-conflict configuration and example behavioral session. (a) Monkeys were presented with visual (optic flow) and/or vestibular (inertial motion) heading stimuli in the horizontal plane. The heading (θ) was varied in fine steps around straight ahead, and the task was to indicate rightward or leftward heading with a saccade after each trial. On a subset of visual-vestibular (‘combined’) trials, the headings specified by each cue were separated by a conflict angle (Δ) of ±4°, where positive Δ indicates visual to the right of vestibular, and vice versa for negative Δ. (b) Psychometric functions for an example session, showing the proportion of rightward choices as a function of heading for the single-cue conditions. Psychophysical thresholds were taken as the standard deviation (σ) of the best-fitting cumulative Gaussian function (smooth curves) for each modality. Single-cue thresholds were used to predict (via Eq. 2) the weights that an optimal observer should assign to each cue during combined trials. (c) Psychometric functions for the combined modality at low (16%) coherence, plotted separately for each value of Δ. The shifts of the points of subjective equality (PSEs) during cue-conflict were used to compute ‘observed’ vestibular weights (Eq. 4). (d) Same as c, but for the high-(60%) coherence combined trials.
Figure 2
Figure 2
Average behavioral performance. (a,b) Optimal (Eq. 2, open symbols and dashed line) and observed (Eq. 4, filled symbols and solid line) vestibular weights as a function of visual motion coherence (cue reliability), shown separately for the two monkeys (a, monkey Y, N = 40 sessions; b, monkey W, N = 26). (c,d) Optimal (Eq. 3) and observed (estimated from the psychometric fits) psychophysical thresholds, normalized separately by each monkey’s vestibular threshold. Error bars in ad represent 95% confidence intervals computed with a bootstrap procedure.
Figure 3
Figure 3
Example MSTd neuron showing a correlate of trial-by-trial cue reweighting. Mean firing rate (spikes/s) ± s.e.m. is plotted as a function of heading for the single-cue trials (a), and combined trials at low (b) and high (c) coherence. The shift in combined tuning curves with cue conflict, in opposite directions for the two levels of reliability, forms the basis for the reweighting effects in the population decoding analysis depicted in Figs. 4 and 6 (see Supplementary Figs. S1 and S2 for single-cell neurometric analyses).
Figure 4
Figure 4
Likelihood-based decoding approach used to simulate behavioral performance based on MSTd activity. (a,b) Example likelihood functions (P(r|θ)) for the single-cue modalities. Four individual trials of the same heading (θ = 1.2°, green arrow) are superimposed for each condition. Likelihoods were computed from Eq. 14 using simulated population responses (r) comprised of random draws of single-neuron activity. (c) Simulated psychometric functions for a decoded population that included all 108 MSTd neurons in our sample. (d,e) Combined modality likelihood functions for θ = 1.2° (green arrow and dashed line) and Δ = +4°, for low (cyan) and high (blue) coherence. Black and red inverted triangles indicate the headings specified by vestibular and visual cues, respectively, in this stimulus configuration. (f) Psychometric functions for the simulated combined modality, showing the shift in the PSE due to coherence (i.e., reweighting).
Figure 5
Figure 5
Visual-vestibular congruency and average MSTd tuning curves. (a) Histogram of congruency index (CI) values for monkey Y (top), monkey W (middle), and both animals together (bottom). Positive congruency index values indicate consistent tuning slope across visual (60% coh.) and vestibular single-cue conditions, while negative values indicate opposite tuning slopes. Filled bars indicate CI values whose constituent correlation coefficients were both statistically significant; however, here we defined ‘congruent’ and ‘opposite’ cells by an arbitrary criterion of CI > 0.4 and CI < −0.4, respectively. (b,c) Population average of MSTd tuning curves for the 5 stimulus – conditions vestibular (black), low coherence visual (magenta, dashed), high coherence visual (red), low coherence combined (cyan, dashed), and high coherence combined (blue) – separated into congruent (b) and opposite (c) classes. Prior to averaging, some neurons’ tuning preferences were mirrored such that all cells preferred rightward heading in the high coherence visual modality.
Figure 6
Figure 6
Population decoding results and comparison with monkey behavior. Weights (left column, same format as Fig. 2a,b; from Eqs. 2 and 4) and thresholds (right column, same format as Fig. 2c,d; from Eq. 3 and psychometric fits to real or simulated choice data) quantifying the performance of an optimal observer reading out MSTd population activity. Thresholds were normalized by the value of the vestibular threshold, and the optimal prediction for the combined modality (cyan dashed lines and open symbols) was computed with Eq. 3. The population of neurons included in the decoder was varied in order to examine the readout of all cells (a,b), opposite cells only (c,d), or congruent cells only (e,f). Monkey behavioral performance (pooled across the two animals) is summarized in g,h. Error bars indicate 95% CIs.
Figure 7
Figure 7
Goodness-of-fit of linear weighted sum model and distribution of vestibular and visual neural weights. Combined responses during the discrimination task (N = 108) were modeled as a weighted sum of visual and vestibular responses, separately for each coherence level. (a,b) Histograms of a goodness-of-fit metric (R2), taken as the square of the correlation coefficient between the modeled response and the real response. The statistical significance of this correlation was used to code the R2 histograms. (c,d) Histograms of vestibular (c) and visual (d) neural weights, separated by coherence (gray bars = 16%, black bars = 60%). Color-matched arrowheads indicate medians of the distributions. Only neurons with significant R2 values for both coherences were included (N = 83).
Figure 8
Figure 8
Comparison of optimal and actual (fitted) neural weights. (a) Actual weight ratios (Aves/Avis) for each cell were derived from the best-fitting linear model (Eq. 5, as in Fig. 7), and optimal weight ratios (ρopt) for the corresponding cells were computed according to Eq. 7. Symbol color indicates coherence (16%: blue; 60%: red) and shape indicates monkey identity. Note that the derivation of Eq. 7 assumes congruent tuning (see Supplementary Material), and therefore ρopt is constrained to be positive (because the sign of the tuning slopes will be equal). Thus, only congruent cells with positive weight ratios were included in this comparison (N = 36 for low coherence, 37 for high coherence). (b,c) Decoder performance (same format as Fig. 6, using Eqs. 2–4 and fits to simulated choice data) based on congruent neurons, after replacing combined modality responses with weighted sums of single-cue responses, using the optimal weights from Eq. 7 (abscissa in a). (d,e) Same as b,c, but using the actual (fitted) weights (ordinate in a) to generate the artificial combined responses.

References

    1. Alais D, Burr D. The ventriloquist effect results from near-optimal bimodal integration. Curr Biol. 2004;14:257–262. - PubMed
    1. Ernst MO, Banks MS. Humans integrate visual and haptic information in a statistically optimal fashion. Nature. 2002;415:429–433. - PubMed
    1. Hillis JM, Watt SJ, Landy MS, Banks MS. Slant from texture and disparity cues: optimal cue combination. J Vis. 2004;4:967–992. - PubMed
    1. Jacobs RA. Optimal integration of texture and motion cues to depth. Vision Res. 1999;39:3621–3629. - PubMed
    1. Knill DC, Saunders JA. Do humans optimally integrate stereo and texture information for judgments of surface slant? Vision Res. 2003;43:2539–2558. - PubMed

Publication types