. 2011 Nov 20;13(1):95-102.
doi: 10.1038/ni.2151.

Principles of dimer-specific gene regulation revealed by a comprehensive characterization of NF-κB family DNA binding

Affiliations

Principles of dimer-specific gene regulation revealed by a comprehensive characterization of NF-κB family DNA binding

Trevor Siggers et al. Nat Immunol. .

Abstract

The unique DNA-binding properties of distinct NF-κB dimers influence the selective regulation of NF-κB target genes. To more thoroughly investigate these dimer-specific differences, we combined protein-binding microarrays and surface plasmon resonance to evaluate DNA sites recognized by eight different NF-κB dimers. We observed three distinct binding-specificity classes and clarified mechanisms by which dimers might regulate distinct sets of genes. We identified many new nontraditional NF-κB binding site (κB site) sequences and highlight the plasticity of NF-κB dimers in recognizing κB sites with a single consensus half-site. This study provides a database that can be used in efforts to identify NF-κB target sites and uncover gene regulatory circuitry.


Figures
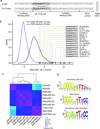
Figure 1
Figure 1
Examining NF-κB dimer binding by custom NF-κB PBMs. (a) Schematic of design of 60 base-pair (bp) DNA sequence probes on custom NF-κB PBM. 10-bp κB sites are positioned at a fixed position along the probe (i.e., relative to the glass slide surface) within constant flanking sequence. Each 10-bp κB site is present at four replicate spots in both the forward (‘Probe’) and reverse complement (‘RC Probe’) orientation (i.e., eight spots in total). (b) Distributions of PBM-derived binding site z-scores for mouse RelA:p50 binding to 3,285 κB sites (black line) and to a background set of 1,200 random 10-bp sequences (blue line). Z-scores for 15 κB sites described in the literature are indicated. (c) Pair-wise comparison of κB site binding for 10 NF-κB dimers. Pair-wise binding similarity was assessed by Pearson correlation of κB site z-scores, and hierarchical clustering was performed on the comparison matrix (see Methods). Three DNA-binding specificity clusters (i.e., class) were identified that correspond to three NF-κB dimer groups: p50,p52 homodimers, heterodimers and c-Rel,RelA homodimers. Representative DNA binding site motifs were determined for each dimer class using the top 25 highest-scoring κB sites bound by each group member (Methods; see Supplementary Fig. 2 for individual motifs).
Figure 2
Figure 2
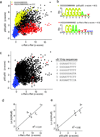
Dimer-specific binding to traditional and non-traditional κB sites. (a) Comparison of the binding by mouse p50:p50 and c-Rel:c-Rel homodimers to 3,285 κB sites (black dots) and a background set of 1,200 random 10-bp sites (blue dots). κB sites conforming to the patterns 5'-GGGGGNNNNN-3' (N = any base) and 5'-HGGAANNNNND-3' (H = not G, D = not C, NNNNN = all 5-bp sequences except those containing CCC triplets) are highlighted in yellow and red, respectively. Binding motifs specific for subsets of κB sites are shown. (b) Z-scores and DNA sequences of six κB sites used in subsequent SPR experiments (see (c) and (d) below and Table 1) are shown. (c),(d) Comparison of SPR-determined binding off-rates (Koff) and PBM-determined z-scores are shown for c-Rel:c-Rel and p50:p50 homodimers, respectively.
Figure 3
Figure 3
Preferences for flanking DNA bases and κB site length. (a) Z-score distributions are shown for 10-bp κB sites with different flanking bases (e.g. identity of N and M in NGGGAATCCCCM). In each panel, column 1 has scores for κB sites with no 5' guanine (forward orientation, N = not G; reverse complement orientation, M = not C); column 2 has scores for κB sites with 5' guanine (N = G); column 3 has scores for κB sites with 5' guanine in reverse complement orientation (M = C). κB sites for which a 5' guanine flanking base (column 2 or 3) results in significantly higher z-scores (p-value < 0.01, one-tailed Student’s t-test) are indicated (10−4 (***), 10−3 (**), 10−2 (*)). Data are shown for PBM experiments performed for p50:p50, RelA:p50 and c-Rel:c-Rel. (b) Z-score distributions are shown for the non-traditional 10-bp κB site 5'-GGGGAATTTT-3' and shorter variant sites. Score distribution for 10-bp sites are as in (a). Score distributions for shorter sites are determined by examining scores from all κB sites in our dataset that contained the sub-site sequence. For example, column 2 labeled xGGGAATTTT has scores from the 4 κB sites where x = A,C,G or T.
Figure 4
Figure 4
Comparison of c-Rel, RelA and RelA/N3,4 homodimer DNA-binding specificity. (a) Comparison of the binding by mouse c-Rel:c-Rel and RelA:RelA homodimers to 3,285 κB sites (black dots) and a background set of 1,200 random 10-bp sites (blue dots). (b) Comparison for c-Rel:c-Rel and RelA/N3,4:RelA/N3,4. (c) Comparison for RelA/N3,4:RelA/N3,4 and RelA:RelA. (d) Comparison for RelA:RelA (replicate experiment) and RelA:RelA.
Figure 5
Figure 5
Enrichment of PBM-determined κB sites in published dataset of p50-bound genomic regions from LPS-stimulated human macrophages. (a) Venn diagram showing the overlap of 183 p50-bound regions with the 205 regions bound by c-Rel, RelB or RelA. Bound regions are the ChIP enriched regions (p-value < 0.002) reported in Figure 1 of Schreiber et al. (b,c,d) Receiver operating characteristic (ROC) curve analyses quantifying the enrichment within p50-bound regions of PBM-determined κB sites are shown for (b) p50, (c) RelA:p50, and (d) RelA. ROC curves describe enrichment within p50-specifically bound regions (blue line), and within regions bound by p50 and at least one of cRel, RelB, or RelA (black line). Area under the ROC curve (AUC) values are reported to quantify the enrichment, and a Wilcox-Mann-Whitney U test was applied to calculate the significance of each AUC value.

References

    1. Baldwin AS., Jr Series introduction: the transcription factor NF-kappaB and human disease. J Clin Invest. 2001;107:3–6. - PMC - PubMed
    1. Tak PP, Firestein GS. NF-kappaB: a key role in inflammatory diseases. J Clin Invest. 2001;107:7–11. - PMC - PubMed
    1. Zhang G, Ghosh S. Toll-like receptor-mediated NF-kappaB activation: a phylogenetically conserved paradigm in innate immunity. J Clin Invest. 2001;107:13–19. - PMC - PubMed
    1. Hiscott J, Kwon H, Genin P. Hostile takeovers: viral appropriation of the NF-kappaB pathway. J Clin Invest. 2001;107:143–151. - PMC - PubMed
    1. Natoli G, Saccani S, Bosisio D, Marazzi I. Interactions of NF-kappaB with chromatin: the art of being at the right place at the right time. Nat Immunol. 2005;6:439–445. - PubMed

Publication types