. 2011 Nov 20;13(2):144-51.
doi: 10.1038/ni.2187.

AHR drives the development of gut ILC22 cells and postnatal lymphoid tissues via pathways dependent on and independent of Notch

Affiliations

AHR drives the development of gut ILC22 cells and postnatal lymphoid tissues via pathways dependent on and independent of Notch

Jacob S Lee et al. Nat Immunol. .

Abstract

Innate lymphoid cells (ILCs) of the ILC22 type protect the intestinal mucosa from infection by secreting interleukin 22 (IL-22). ILC22 cells include NKp46(+) and lymphoid tissue-inducer (LTi)-like subsets that express the aryl hydrocarbon receptor (AHR). Here we found that Ahr(-/-) mice had a considerable deficit in ILC22 cells that resulted in less secretion of IL-22 and inadequate protection against intestinal bacterial infection. Ahr(-/-) mice also lacked postnatally 'imprinted' cryptopatches and isolated lymphoid follicles (ILFs), but not embryonically 'imprinted' Peyer's patches. AHR induced the transcription factor Notch, which was required for NKp46(+) ILCs, whereas LTi-like ILCs, cryptopatches and ILFs were partially dependent on Notch signaling. Thus, AHR was essential for ILC22 cells and postnatal intestinal lymphoid tissues. Moreover, ILC22 subsets were heterogeneous in their requirement for Notch and their effect on the generation of intestinal lymphoid tissues.


Figures
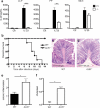
Figure 1
Figure 1
AHR is essential for IL-22-production in the intestinal LP and resistance to C. rodentium infection. (a) Cells were isolated from siLP, PP, and MLN of AHR-/- and WT mice. Identical numbers of cells were stimulated with IL-23. IL-22 released in culture supernatant was measured by ELISA. One experiment representative of two is shown. (b) Survival rates after C. rodentium infection. AHR-/- mice and WT mice were orally inoculated with C. rodentium. Data are from 2 independent experiments (n=6). (c,d) Histological analysis from H&E staining of representative colons from WT (c) and AHR-/- (d) mice 6 days post inoculation reveals increased mucosal hyperplasia and epithelial erosion in AHR-/- colons. Scale bars 25μm. (e) Histological scores for colons from WT and AHR-/- mice from (c and d). (f) C. rodentium titers in the spleen 6 days after inoculation.
Figure 2
Figure 2
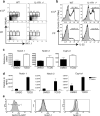
IL-22 producing-NK like cells are markedly reduced in AHR-/- mice. (a, b) siLP (a) and PP (b) cells were isolated from AHR-/- or WT mice and stimulated with IL-23. Intracellular content of IL-22 was determined in CD3-CD19-NKp46+ cells. Numbers above bracketed lines indicate percent of IL-22+ cells (mean ± s.d.) Data are representative of 2 independent experiments (n=3). (c) Cells were isolated from siLP and PP of WT and AHR-/- mice, stained for CD3, CD19, NKp46 and NK1.1 and analyzed by flow cytometry. Numbers above outlined areas indicate percent cells gated on CD3-CD19- cells. (d) Quantification of NKp46+NK1.1-, NKp46+NK1.1lo, and NKp46+NK1.1+ subsets in siLP and PP of AHR-/- and WT mice (y-axis = percent cells). Data points represent individual mice and indicate frequency of cells gated on CD3-CD19- cells. (e,f) Representative flow cytometry analysis of cells isolated from the siLP (e) and PP (f) of AHR-/- and WT animals. Cells are gated on CD3-CD19-CD4- and numbers in the quadrants represent percent cells in each.
Figure 3
Figure 3
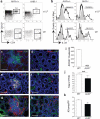
AHR-/- mice lack CD4+LTi-like ILC as well as CP and ILF in the small intestine. (a) Flow cytometry analysis of cells isolated from the PP and siLP of AhR-/- or WT mice. Plots show cells gated on CD3-CD19-NKp46- and numbers above outlined areas indicate percent cells in each. Data are representative of 2 independent experiments (n=4). (b) Intracellular IL-22 expression in IL-23 stimulated LTi-like ILC from siLP or PP (gated on CD3-CD19-NKp46-CD4+). Numbers above bracketed lines represent percent IL-22+ cells (mean ± s.e.m.). Data are representative of 2 independent experiments (n=4). (c,d,e,f,g,h) Immunohistochemistry to identify cryptopatch CD90+c-kit+ clusters as well as CD11c+ and B220+ cells associated with CP and ILF in the small intestine. (c,d) CD90 in green, NKp46 in red in WT (c) and AHR-/- mice (d). (e,f) CD90 in green, c-kit in red in WT (e) and AHR-/- mice (f). (g,h) CD11c in green and B220 in red in WT (g) and AHR-/- mice (h). Scale bar for (c to h) 50μm. (i) Quantification of total CD90+ clusters along the small intestine (SI). (j) Frequency of PP along the small intestine (SI). ND – not detected. NS – not significant. (k) Quantification of the number of domes per PP along the whole intestine.
Figure 4
Figure 4
The developmental defect of AHR-/- mice is cell-intrinsic. (a,b) siLP from AHR-/- and AHR+/+ mice were harvested and analyzed by FACS for CD4+ and CD8+ T cells (a) and dendritic cell populations (b). Cells are gated on CD3+ lymphocytes (a) and on CD19-CD11c+ populations (b). (c) siLP cells from AHR-/- into wildtype and wildtype into wildtype bone marrow (BM) chimeras were harvested and analyzed by FACS. Cells are gated on CD45.2+CD3-CD19-CD4-NKp46+. The bottom bar represents percent of NKp46+NK1.1- cells from AHR-/- reconstituted cells, and top bar represent percent of NKp46+NK1.1- cells from AHR+/+ reconstituted cells. Right panel represents fold increase in IL-22+ cells from IL-23 stimulated cells gated on CD3-CD19-NKp46+ cells from AHR-/- and AHR+/+ chimeras (n=4). AHR-/- BM reconstituted mice show reduced frequencies of NKp46+ILC compared to WT BM reconstituted mice. The reconstitution of WT NKp46+ILC in irradiated WT mice was incomplete. (d) siLP cells from mixed AHR-/- and WT bone marrow chimeras were analyzed by gating on CD45.2+CD3-CD19-CD4-NKp46+ (AHR-/-) cells and CD45.2-CD3-CD19-CD4-NKp46+ (AHR+/+) cells and reconstitution of NKp46+ILC were compared. Bottom bar represent percent of NKp46+NK1.1- cells in AHR-/- cells, and top bar represent percent of NKp46+NK1.1- cells in AHR+/+ cells. Right panel represents fold increase in IL-22+ from IL-23 stimulated cells gated on CD3-CD19-NKp46+ from AHR-/- and AHR+/+ mixed chimeras. (n=3) (e,f) Cells isolated from the siLP of control (AHR-RORγt-cre-/-) and AHR conditional deletion (AHR–RORγt-cre-/Tg) mice were harvested and analyzed by FACS for NKp46+ ILC (e) and CD4+ LTi-like ILC (f) populations. Graphs show absolute numbers of cells. (n=4) Cells were also compared to absolute numbers of NKp46+ ILC (e) and CD4+ LTi-like ILC (f) populations from AHR-/- siLP from (supplementary fig. 4)
Figure 5
Figure 5
AHR activation induces the upregulation of Notch. (a) Cells isolated from the PP and the siLP of IL-1R1-/- and WT mice were stained for CD3, CD19, NKp46, NK1.1 and analysed by flow cytometry. Cells are gated on CD3-CD19-cells and numbers above outlined areas indicate percent cells in each. (n=4). (b) Cells from PP and siLP were isolated from IL-1R1-/- or WT mice and stimulated with IL-23. Intracellular IL-22 was analyzed by flow cytometry. The values above bracketed lines indicate percentages of IL-22+ cells in CD3-CD19-NKp46+ cells (mean ± s.e.m.). Data are representative of 2 independent experiments (n=3 siLP or n=4 PP). (c) Mice were treated with 30ug/kg TCDD or DMSO by oral gavage and 3hrs later the liver was harvested and RNA was extracted for qPCR analysis of Notch 1, Notch 2 and Cyp1a1 expression. (d) Mice were treated with 30ug/kg TCDD or DMSO by oral gavage as in (c) and cells from the small intestine lamina propria were harvested and RNA was extracted for qPCR analysis of Notch 1, Notch 2 and Cyp1a1 expression. (e) NKL cell line transduced with a constitutively active AHR expression plasmid was analyzed by flow cytometry for expression of Notch 1 and Notch 2. Shaded histograms represent cells gated on GFP- untransduced cells and clear histograms represent cells gated on GFP+ transduced cells.
Figure 6
Figure 6
IL-22 producing NK-like cells are reduced in RBP-Jκf/f × Cre-Vav1 mice. (a) siLp from RBP-Jκf/f and RBP-Jκ-/- mice were harvested and analyzed by FACS for NKp46+ILC. The cells in the top panel are gated on CD3-CD19-. Intracellular staining for IL-22 on the bottom panels show cells gated on CD3-CD19-NKp46+ cells. (b) siLP from RBP-Jκf/f and RBP-Jκ-/- mice were harvested and analyzed by FACS for CD4+ LTi-like ILC. Cells are gated on CD3-CD19-. (c) Quantification of the frequency of NKp46+ and LTi-like ILC from (a and b). (d) Immunohistochemistry to identify CD11c+ and B220+ cells associated with CP and ILF in the small intestine. CD11c in green and B220 in red in RBP-Jκf/f and RBP-Jκ-/- mice. Scale bar 50μm. (e) Quantification of total CD90+ clusters along the small intestine (SI).

Comment in

  • You AhR what you eat?
    Lawrence BP, Sherr DH. Lawrence BP, et al. Nat Immunol. 2012 Jan 19;13(2):117-9. doi: 10.1038/ni.2213. Nat Immunol. 2012. PMID: 22261961 No abstract available.

Similar articles

Cited by

References

    1. Hooper LV, Macpherson AJ. Immune adaptations that maintain homeostasis with the intestinal microbiota. Nat Rev Immunol. 2010;10:159–69. - PubMed
    1. Asquith M, Powrie F. An innately dangerous balancing act: intestinal homeostasis, inflammation, and colitis-associated cancer. J Exp Med. 2010;207:1573–7. - PMC - PubMed
    1. Hand T, Belkaid Y. Microbial control of regulatory and effector T cell responses in the gut. Curr Opin Immunol. 2010;22:63–72. - PMC - PubMed
    1. Eberl G, Lochner M. The development of intestinal lymphoid tissues at the interface of self and microbiota. Mucosal Immunol. 2009;2:478–85. - PubMed
    1. Ouyang W, Kolls JK, Zheng Y. The biological functions of T helper 17 cell effector cytokines in inflammation. Immunity. 2008;28:454–67. - PMC - PubMed

Publication types

MeSH terms