. 2011 Nov 20;17(12):1585-93.
doi: 10.1038/nm.2505.

Crosstalk between B lymphocytes, microbiota and the intestinal epithelium governs immunity versus metabolism in the gut

Affiliations

Crosstalk between B lymphocytes, microbiota and the intestinal epithelium governs immunity versus metabolism in the gut

Natalia Shulzhenko et al. Nat Med. .

Abstract

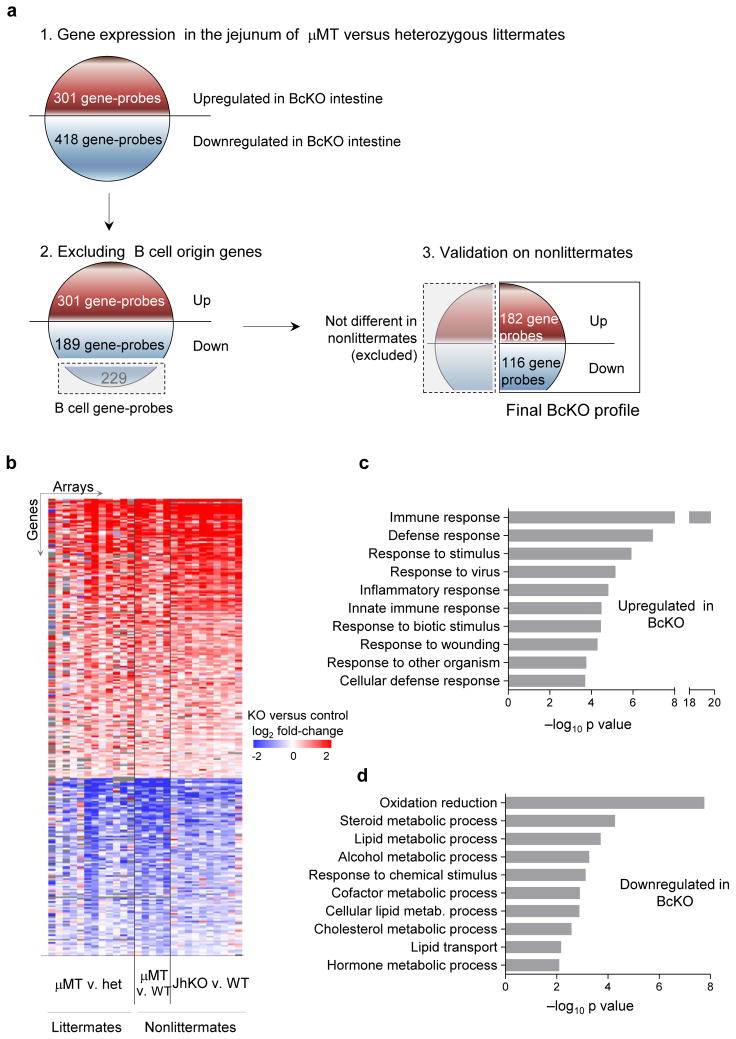
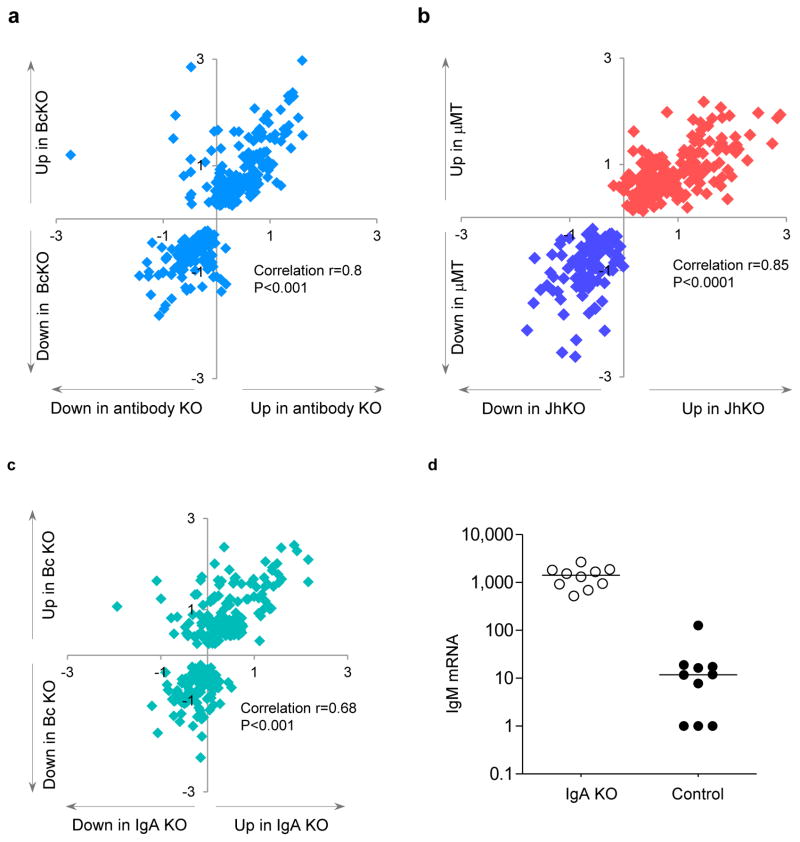
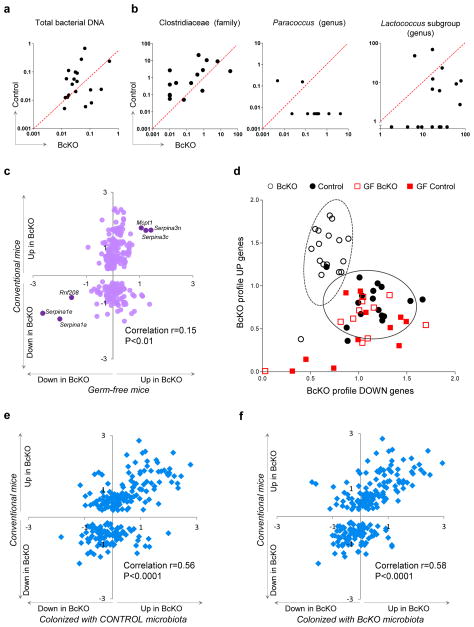
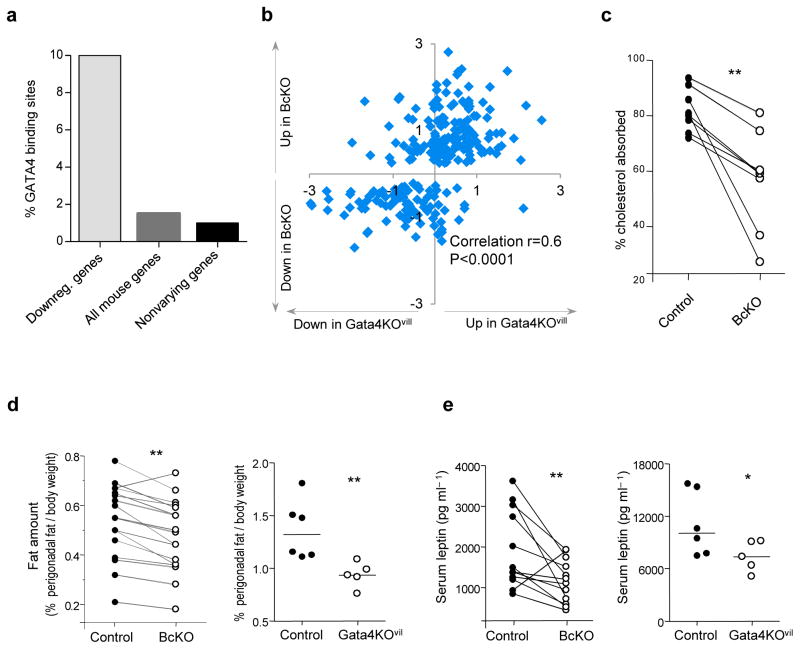
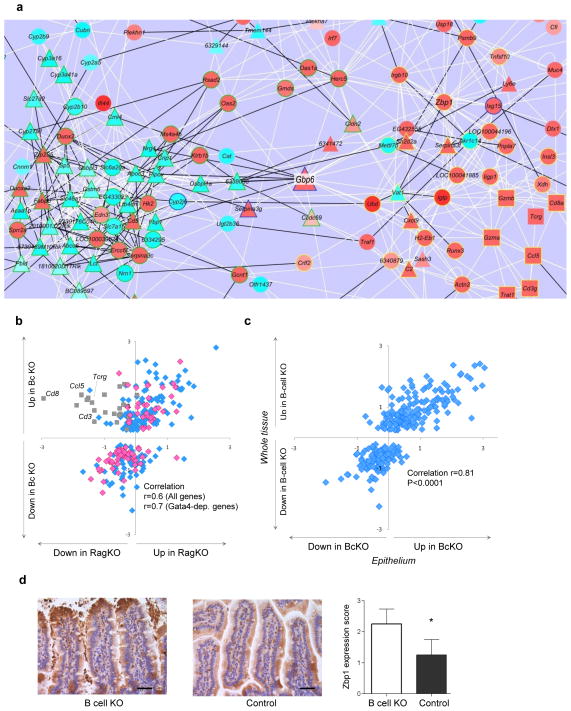
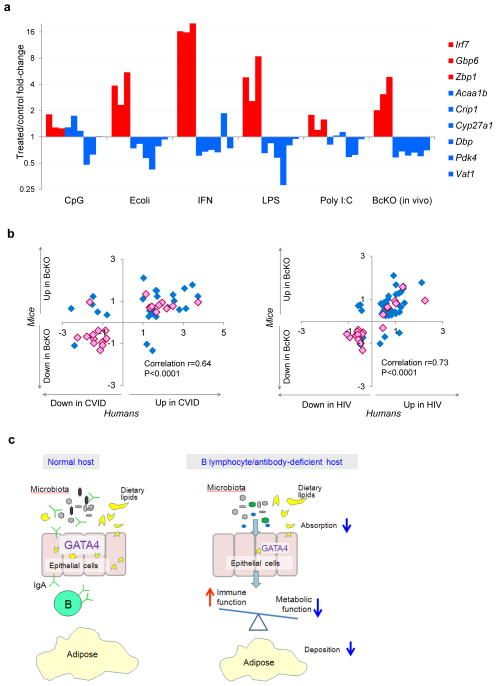
Using a systems biology approach, we discovered and dissected a three-way interaction between the immune system, the intestinal epithelium and the microbiota. We found that, in the absence of B cells, or of IgA, and in the presence of the microbiota, the intestinal epithelium launches its own protective mechanisms, upregulating interferon-inducible immune response pathways and simultaneously repressing Gata4-related metabolic functions. This shift in intestinal function leads to lipid malabsorption and decreased deposition of body fat. Network analysis revealed the presence of two interconnected epithelial-cell gene networks, one governing lipid metabolism and another regulating immunity, that were inversely expressed. Gene expression patterns in gut biopsies from individuals with common variable immunodeficiency or with HIV infection and intestinal malabsorption were very similar to those of the B cell-deficient mice, providing a possible explanation for a longstanding enigmatic association between immunodeficiency and defective lipid absorption in humans.


Conflict of interest statement

COMPETING FINANCIAL INTERESTS

The authors declare no competing financial interests.

Figures

Figure 1
Figure 1
Dysregulation of gene expression in the small intestine of BcKO mice. (a) Diagram of discovery of B cell KO profile (see details in Methods). (b) Heatmap of the differentially expressed genes (BcKO profile) in the jejunum of BcKO mice and their corresponding controls (FDR <10%). Each line represents one gene probe; each column represents one array; color represents the difference between BcKO and the corresponding control on that array, blue indicating lower and red higher expression in BcKO mice; gray color indicates missing values; het, heterozygous. (c) Enrichment of Gene Ontology categories (Biological Process) for the up- and downregulated genes in BcKO mice. The top ten categories are shown.
Figure 2
Figure 2
Dysregulation of gene expression is present in the gut of antibody-deficient and IgA-deficient mice. (a) Gene expression ratios between BcKO and control (WT and heterozygous) mice (y axis, n = 27 per group) and between antibody-deficient versus heterozygous control mice (x axis; n = 9 per group). (b) Gene expression ratios in two strains of BcKO mice: B10A-μMT versus control (WT and heterozygous) mice (y axis, n = 17 per group) and BALB/c-JhKO versus WT control mice (x axis; n = 10 per group). (c) Gene expression ratios between BcKO and control (y axis; 27 per group) and between immunoglobulin A-deficient (IgA) and heterozygous control (x axis; n = 10 per group) mice. Similarity of gene expression profile between the experiments was estimated using Pearson’s correlation. Each symbol represents one gene from the BcKO profile established in Figure 1. The values on axes are log2 fold change knockout versus control. (d) Levels of IgM transcripts (probe intensities on arrays) in the jejunum of IgA KO and heterozygous control mice (P < 0.001).
Figure 3
Figure 3
Microbiota are necessary for intestinal alterations in BcKO mice. (a) Amount of total bacterial DNA (ng) per 10 ng of isolated total DNA from jejunum content of BcKO and control mice (each dot represents data from two mice of the same litter. (b) Amount of DNA (pg) for Clostridiacea (family), Paraccococus (genus) and for an operational taxonomic unit corresponding to a subgroup of Lactococcus (genus) per 10 ng of isolated total DNA from jejunum content of BcKO and control mice. Data represented as in a. (c) Gene expression ratios between BcKO and control (WT and heterozygous) (y axis; n = 27 per group) and between germ-free BcKO versus germ-free control (WT and heterozygous) mice (x axis; n = 11 per group). Each symbol represents one gene. Six genes that are differentially expressed between germ-free BcKO and germ-free control mice are labeled. (d) Two-dimensional visualization of the gene expression of upregulated (BcKO profile up) and downregulated (BcKO profile down) genes in four groups of mice. Each symbol represents one mouse. Values are summary metrics of upregulated (y axis) and downregulated (x axis) genes of the BcKO profile. Ellipses were represent two s.d. from the centroids for BcKO (dashed) and Control (black) groups ]. (e) Gene expression ratios between conventional BcKO and control (WT and heterozygous) mice (y axis; n = 27 per group) and between ex–germ-free BcKO versus control mice colonized with microbiota from control mice (x axis; n = 8 per group). (f) Gene expression ratios between conventional BcKO and control (WT and heterozygous) mice (y axis; n = 27 per group) and between ex–germ-free BcKO versus control mice colonized with microbiota from control mice (x axis; n = 5 per group). Each symbol represents one gene in e and f. Unless otherwise indicated, the control mice were heterozygotes.
Figure 4
Figure 4
Gata4 is a major regulator responsible for fat absorption and accumulation in BcKO mice. (a) Proportion of Gata4 binding sites in the promoters of downregulated genes from BcKO profile, from all known mouse genes and from ~1,000 nonvarying genes expressed in the jejunum (P < 1 × 10⁻¹⁴). (b) Gene expression ratios between BcKO versus WT and heterozygous control (y axis; n = 27 per group) and between GATA4 KOvil versus heterozygous control mice (x axis; n = 5 per group). Each symbol represents one gene. (c) Intestinal cholesterol absorption in BcKO and heterozygous littermates. Each dot represents one mouse. Each line represents one litter. (d) Proportion of perigonaldal fat (gram) in relation to total body weight (gram) in BcKO (left), Gata4KOvil (right) and their corresponding heterozygous control mice. (e) Serum leptin levels in BcKO (left) and Gata4KOvil (right) mice and their corresponding heterozygous control mice. (*P < 0.05; **P < 0.01). In d,e, for BcKO and control mice, each dot represents median value of each genotype in a given litter and each line represents one litter. For Gata4KOvil mice, each dot represents one mouse.
Figure 5
Figure 5
Increased immune and decreased metabolic state of epithelium in BcKO mice. (a) Gene expression network of BcKO profile reconstructed from the data of control mice (zoomed in to the central part of the network; the whole network is in Supplementary Fig. 5a). Each line represents a correlation, and each node represents a gene. White lines are positive and black are negative correlations; triangles are Gata4-dependent genes, squares are the T cell genes and circles are all other genes; red node fills indicate upregulation, and light blue fills are downregulation; green node outline is a subnetwork 1, yellow is a subnetwork 2, and unoutlined node symbols do not belong to either of the two subnetworks. (b) Gene expression ratios between BcKO versus control (y axis; n = 27 per group) and between RAGKO versus control (x axis; n = 8 per group) mice. Each symbol represents one gene. Grey squares are T cell–related genes. Pink diamonds are Gata4-dependent genes; blue are all other genes. (c) Gene expression ratios between gut whole tissue of BcKO versus control mice (y axis; n = 27 per group) and between intestinal epithelium of BcKO versus control mice (x axis; n = 3 per group). Each symbol represents one gene. (d) Immunohistochemistry for Zbp1 in jejunum of BcKO and control mice (n = 4 per group) and the results of semiquantitative blind evaluation (*P < 0.05; bars represent s.d.); scale bar, 40 μm.
Figure 6
Figure 6
Balance between immune and metabolic processes in vitro and in vivo in mice and humans. (a) Influence of different stimuli on immune (red) and metabolic (blue) gene expression in intestinal epithelial cells in vitro. MODE-K cells were incubated for 24 h with different stimuli. Gene expression assessed by real-time PCR is represented as median fold change compared to untreated cells in five independent experiments. For comparison, the right-most columns show the fold changes detected in jejunum of BcKO mice compared to control mice. Supplementary Figure 9 shows P values for all comparisons. (b) Gene expression ratios between BcKO versus control mice (y axis; n = 27 per group) and between individuals with CVID versus individuals with normal gut histology (x axis; n = 3 per group; left); and between BcKO versus control mice (y axis; n = 27 per group) and between HIV-infected individuals versus healthy controls (x axis; n = 3 per group; right). The Pearson correlation between log2 ratios for mice and humans is shown. GATA4-dependent genes are shown in pink. (c) A schematic diagram illustrating that, unlike the situation with replete B cells, the balance between immune and metabolic processes within gut epithelial cells in hosts lacking B lymphocytes or IgA antibodies is skewed towards an immune response against microbiota (gray, black, green and blue ovoid objects) at the expense of GATA4-related metabolism, mainly lipid absorption and deposition.

Comment in

References

    1. Cerf-Bensussan N, Gaboriau-Routhiau V. The immune system and the gut microbiota: friends or foes? Nat Rev Immunol. 2010;10:735–744. - PubMed
    1. Hooper LV, Macpherson AJ. Immune adaptations that maintain homeostasis with the intestinal microbiota. Nat Rev Immunol. 2010;10:159–169. - PubMed
    1. Umesaki Y, Setoyama H, Matsumoto S, Imaoka A, Itoh K. Differential roles of segmented filamentous bacteria and clostridia in development of the intestinal immune system. Infect Immun. 1999;67:3504–3511. - PMC - PubMed
    1. Ivanov II, et al. Induction of intestinal TH17 cells by segmented filamentous bacteria. Cell. 2009;139:485–498. - PMC - PubMed
    1. Gaboriau-Routhiau V, et al. The key role of segmented filamentous bacteria in the coordinated maturation of gut helper T cell responses. Immunity. 2009;31:677–689. - PubMed

Publication types

MeSH terms