. 2012 Feb;42(2):489-99.
doi: 10.1002/eji.201141758. Epub 2011 Dec 16.

Role of Hedgehog signalling at the transition from double-positive to single-positive thymocyte

Affiliations
Free PMC article

Role of Hedgehog signalling at the transition from double-positive to single-positive thymocyte

Anna L Furmanski et al. Eur J Immunol. 2012 Feb.
Free PMC article

Abstract

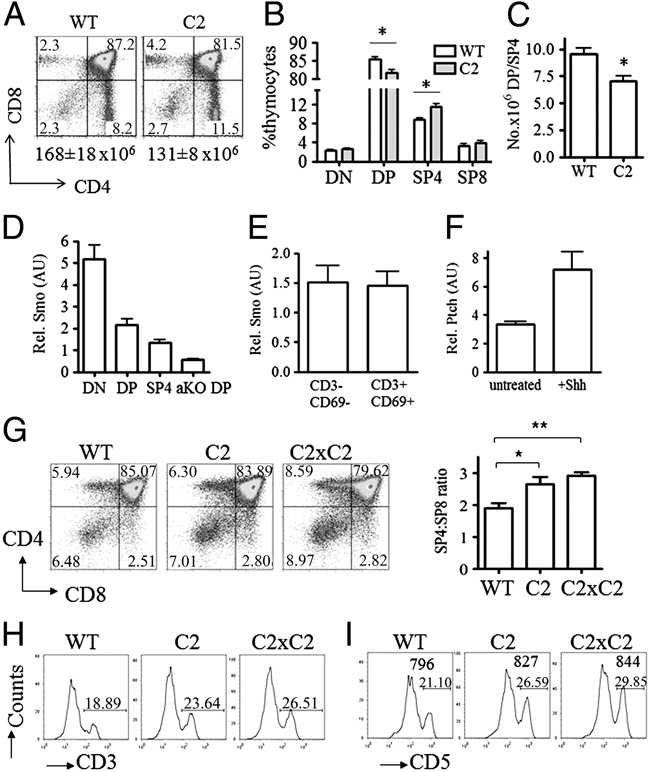
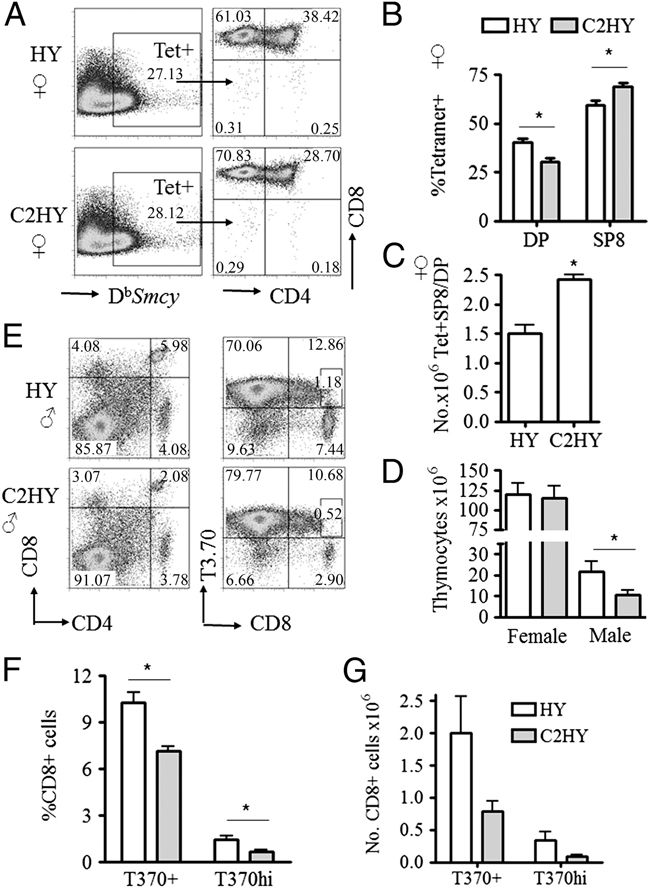
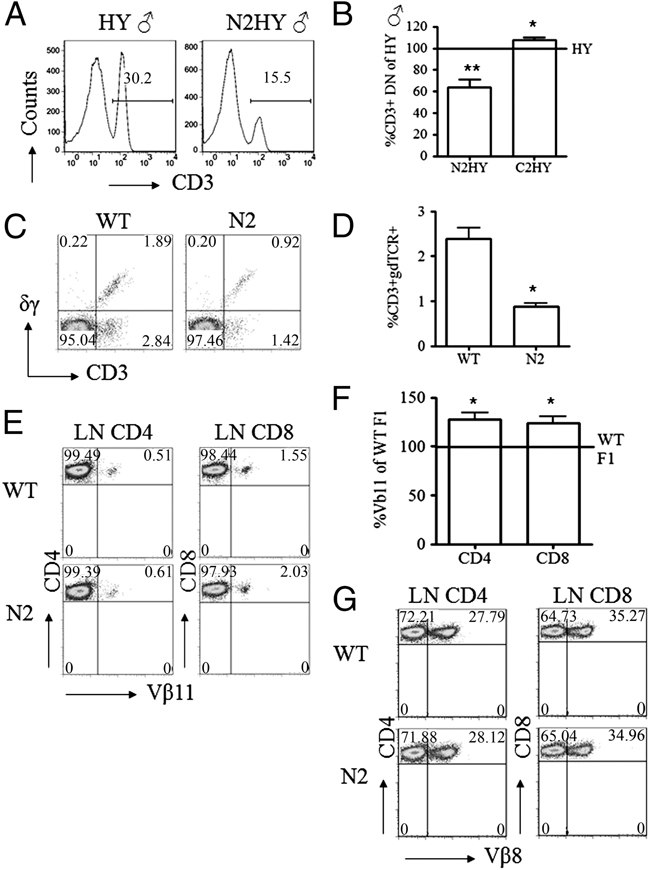
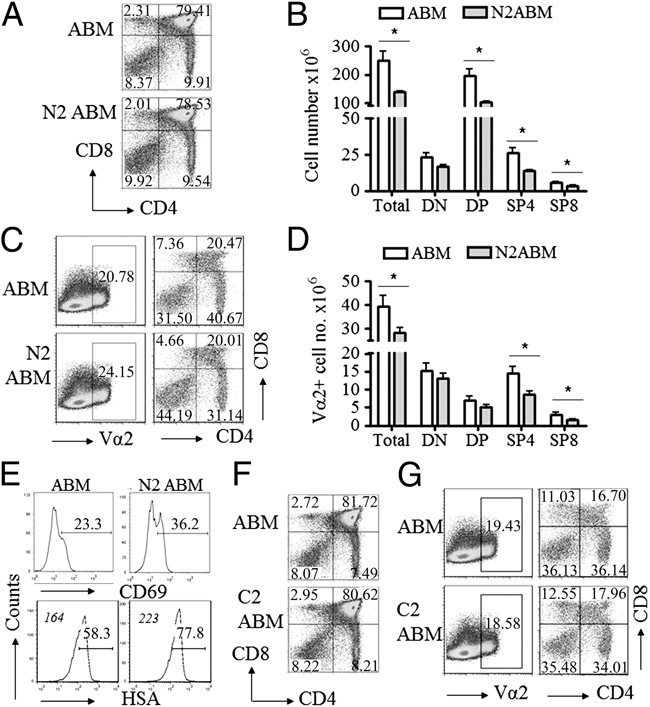
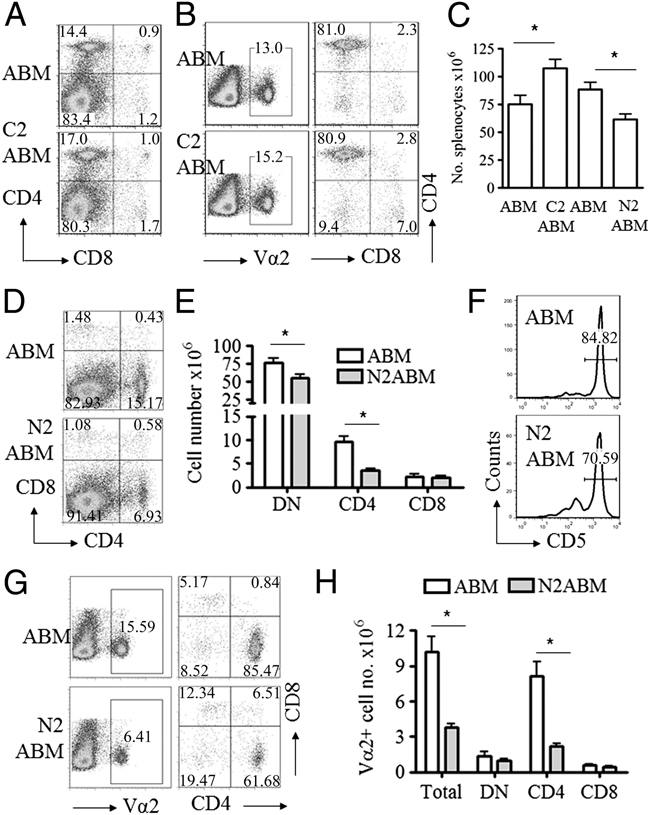
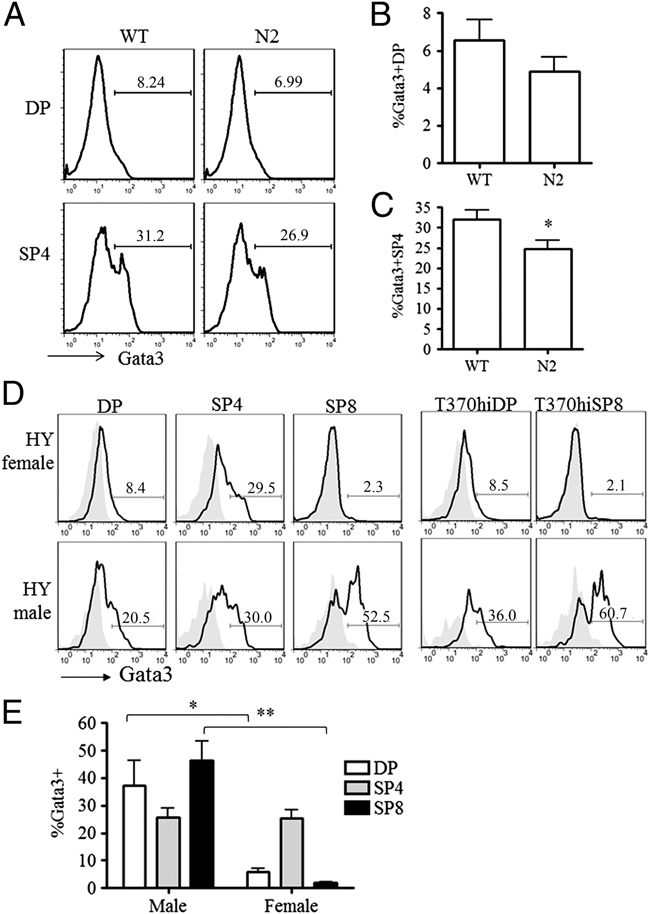
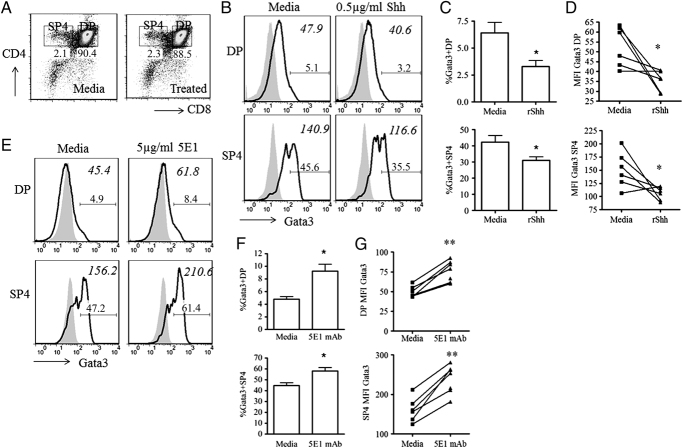
In the thymus, developing T cells receive signals that determine lineage choice, specificity, MHC restriction and tolerance to self-antigen. One way in which thymocytes receive instruction is by secretion of Sonic hedgehog (Shh) from thymic epithelial cells. We have previously shown that Hedgehog (Hh) signalling in the thymus decreases the CD4:CD8 single-positive (SP) thymocyte ratio. Here, we present data indicating that double-positive (DP) thymocytes are Hh-responsive and that thymocyte-intrinsic Hh signalling plays a role in modulating the production of CD4(+) (SP4), CD8(+) (SP8) and unconventional T-cell subsets. Repression of physiological Hh signalling in thymocytes altered the proportions of DP and SP4 cells. Thymocyte-intrinsic Hh-dependent transcription also attenuated both the production of mature SP4 and SP8 cells, and the establishment of peripheral T-cell compartments in TCR-transgenic mice. Additionally, stimulation or withdrawal of Hh signals in the WT foetal thymus impaired or enhanced upregulation of the CD4 lineage-specific transcription factor Gata3 respectively. These data together suggest that Hh signalling may play a role in influencing the later stages of thymocyte development.


Figures

Figure 1
Figure 1
DP cells are responsive to Hh signalling, and repression of Hh signalling in thymocytes enhances SP4 differentiation in FTOC. (A) WT and C2 thymi were analysed by flow cytometry for CD4 and CD8 expression. The number underneath each representative flow cytometry plot indicates the mean total thymic cell count±SEM for WT (n=6) and C2 (n=9) mice. (B) The proportions of cells in the thymocyte subsets shown in (A) were quantified in WT (white bars, n=6) and C2 littermates (shaded bars, n=9, *p=0.01, WT is compared with C2 for each subset using Student's t-test). (C) Mean absolute numbers of cells±SEM in DP (WT 142.6±34.7×10⁶; C2 106.8±20.2×10⁶) and SP4 (WT 15.3±4.9×10⁶; C2 15.6±3.7×10⁶) was determined for WT (n=6) and C2 (n=9) mice and the ratio of the number of DP cells to SP4 calculated. (D, E) Smo expression (AU, arbitrary units) relative to Hprt expression measured by qPCR in (D) WT DN, DP and SP4 sorted cells, and in TCRαKO DP cells and (E) in sorted pre-selection (CD3-CD69) and post-selection (CD3+CD69+) WT DP cells. (F) Ptch expression relative to Hprt expression was measured by qPCR in TCRαKO DP cells cultured for 24 h in the presence/absence of 500 ng/mL rShh. All qPCR experiments show mean±SD of triplicates and are representative of at least two independent experiments. (G) WT, C2 and C2×C2 E15.5 FTOCs were cultured for 7 days and the proportion of DP and SP thymocytes in WT (n=7), C2 (n=5) and C2×C2 (n=9) FTOCs analysed. Representative flow cytometry plots are shown and the SP4:SP8 cell ratio was calculated for all FTOC and presented as mean±SEM (t-test WTvC2 *p<0.02, WTvC2xC2 **p<0.0001; one-way ANOVA, p=0.0003). Relative expression of (H) TCR CD3 and (I) CD5 on SP4 cells. MFI of cells in the CD5+ peak is indicated in large type. For (H) and (I) data were obtained for WT (n=7), C2 (n=5) and C2×C2 (n=9) thymus lobes, the plots are representative.
Figure 2
Figure 2
Positive selection and clonal deletion of CD8+ T cells is enhanced by repression of Hh-dependent transcription in thymocytes. (A) Representative staining of thymocytes from HY and C2HY female mice with anti-CD8, -CD4 and DbSmcy tetramer. (B) %DPTet+ and %SP8Tet+ cells were analysed in groups of female HY (white bars, n=4) and C2HY (shaded bars, n=6, *p=0.01) mice as defined in (A), and absolute cell numbers were then calculated as mean±SEM: Tet+DP cells (HY: 13.8±2×10⁶; C2HY: 9.9±2.5×10⁶) and Tet+SP8 cells (HY: 20.6±3.9×10⁶; C2HY: 24.0±6.6×10⁶). (C) For all mice in (B), the ratio of the number of Tet+SP8 cells to Tet+DP cells was calculated and is displayed as mean±SEM (*p=0.0006). (D) Mean±SEM thymus cellularity in female HY (white bar, n=5) and C2HY (grey bar, n=7) groups, and male HY (white bar, n=5) and C2HY (grey bar, n=4, p<0.05) groups. (E) CD4, CD8 and HY-TCR α-chain+ (T3.70+) expression on thymocytes representative of male HY (n=5) and C2HY (n=4) mice. (F, G) Mean±SEM of percentages (F) and absolute numbers (G) of CD8+ T3.70+ or T3.70hi (HY group compared with C2HY group: *p<0.01) thymocytes compared between HY (white bars, n=5) and C2HY (shaded bars, n=4) groups.
Figure 3
Figure 3
Development of unconventional T-cell subsets is attenuated by Hh signalling in T-lineage cells. (A) Expression of CD3 on DN (CD4CD8) LN lymphocytes in male HY and N2HY mice. Results are representative of HY (n=8) and N2HY (n=6) mice. (B) Proportion (mean±SEM) CD3+DN LN T-cells in male N2HY (n=6) and C2HY (n=5) mice calculated as a percentage of that in the relevant HY littermate groups (*p<0.04, **p<0.0004 in comparison with the relevant HY littermate groups). (C) Representative flow cytometry plots and (D) quantified percentages (mean±SEM for WT n=4, N2 n=6, p<0.0001) of CD3+γδTCR+ cells in the CD4CD8 gate of LN T cells. (E) Representative flow cytometry plots of Vβ11 expression on LN CD4+ and CD8+ T cells of WT and F1 mice from N2+C57BL/6 by BALB/c crosses. (F) Proportion (mean+SEM) of CD4+ or CD8+ Vβ11+ T cells in the N2+ F1 group (n=6) calculated as a percentage of that in WT F1 littermates (n=6) (set to 100%) (*p<0.05 compared with the WT F1 littermates). (G) Representative flow cytometry showing Vβ8 expression in LN CD4+ and CD8+ T cells of F1 mice from N2 C57BL/6 by BALB/c crosses.
Figure 4
Figure 4
Influence of Hh-dependent transcription on the selection of CD4+ T cells. (A) Representative ABM and N2ABM CD4/CD8 thymus profiles and (B) quantified (mean+SEM) thymocyte cell subset numbers in ABM (n=4) and N2ABM (n=5, *p<0.03) groups. (C) Representative CD4/CD8 profiles within the Vα2+ gate and (D) quantified (mean±SEM) cell numbers in the indicated thymocyte subsets of all ABM (n=4) and N2 ABM (n=5, *p<0.05) mice within the Vα2+ gate. For B and D, means were compared between ABM (white) and N2ABM (shaded) groups for each subset. (E) Plots of the expression of CD69 and HSA on SP4 thymocytes, representative of ABM (n=5) and N2ABM (n=8, %CD69 p=0.008; %HSA p=0.01) groups, MFI is in italics. (F) CD4/CD8 thymus profiles representative of ABM (n=6) and C2ABM (n=7) mice. (G) CD4/CD8 profiles within the Vα2+ gate (ABM TCR+) representative of ABM (n=5) and C2ABM (n=6) mice.
Figure 5
Figure 5
TCR-dependent peripheral establishment of the CD4+ T-cell compartment is attenuated by Hh signalling in T cells. (A, B) CD4/CD8 spleen profiles representative of ABM (n=6) and C2ABM (n=6) (A) within live gates and (B) representative of ABM (n=4) and C2ABM (n=5) within Vα2+ gates. (C) Spleen cell number (mean+SEM) of ABM (n=7) and C2ABM (n=7) littermate groups, and ABM (n=4) and N2ABM (n=8) littermate groups (*p<0.02). (D) CD4/CD8 spleen profiles representative of ABM (n=5) and N2ABM (n=8) mice. (E) Cell numbers (mean±SEM) within spleen cell subsets of ABM (n=5) and N2ABM (n=8, *p<0.03) mice. (F) Expression of CD5 (% positive) on CD4+ splenocytes representative of ABM (n=4) and N2ABM (n=8) mice (p=0.04). (G) Spleen CD4/CD8 profiles within the Vα2+ gate representative of ABM (n=5) and N2ABM (n=8). (H) Cell numbers (mean+SEM) in Vα2+ splenocyte subsets of ABM (n=5) and N2ABM (n=8, *p<0.0007) groups. Within splenocyte subsets in E and H, cell number is compared between ABM (white bars) and N2ABM (shaded bars).
Figure 6
Figure 6
Gata3 expression is regulated by Hh-dependent transcription. (A) Representative and (B, C) quantified (total mean±SEM) intracellular Gata3 expression in DP and SP4 thymocytes from WT (n=7) and N2 (n=9, *p=0.03) thymi. (D) Representative and (E) quantified (total mean+SEM) Gata3 expression in HY TCR transgenic male (n=5) and female (n=4, male vs. female *p=0.007; **p=0.0008) DP, SP4 and SP8 thymocytes, and (D) in T3.70hi (HY TCRαhi) DP and SP8 cells. Shaded histograms show isotype control staining.
Figure 7
Figure 7
Physiological Hh signalling attenuates Gata3 expression in DP and SP4 cells. (A) Example of the CD4/CD8 gating strategy used for FTOC cultures. (B) Representative; bars show % Gata 3+ Italic numbers show MFI, and (C) quantified (mean of litters+SEM) intracellular Gata3 expression in WT (C57BL/6) DP and SP4 cells from E17.5 paired embryonic thymus lobes (n=11 embryos, one lobe per treatment, *p<0.02) following 48 h culture in the presence or absence of rShh (500ng/mL). (D) Change in MFI of Gata3 staining after treatment of these lobes from a representative experiment (one litter of six embryos). (E-G) WT E17.5 paired embryonic thymus lobes (n=12 embryos, one lobe per treatment, *p<0.001) were cultured for 48 h with or without anti-Shh neutralising mAb 5E1 (5 μg/mL). (E) Representative flow cytometry plots; bars show %Gata3+, italic numerals show MFI. (F) Quantified (mean of litters±SEM) intracellular Gata3 expression and (G) MFI of Gata3 staining after 5E1 treatment shown for a representative experiment (one litter of six embryos). Representative MFI of Gata3 staining in (D) and (G) compares untreated and treated lobes from the same embryo respectively. Paired t-tests assessed significance in (C, D, F and G) with and without treatment (*p<0.01, **p<0.001). Shaded histograms show isotype control staining.

Similar articles

Cited by

References

    1. Wells FB, Gahm SJ, Hedrick SM, Bluestone JA, Dent A, Matis LA. Requirement for positive selection of gamma delta receptor-bearing T cells. Science. 1991;253:903–905. - PubMed
    1. Singer A, Adoro S, Park JH. Lineage fate and intense debate: myths, models and mechanisms of CD4− versus CD8− lineage choice. Nat. Rev. Immunol. 2008;8:788–801. - PMC - PubMed
    1. Takahama Y. Journey through the thymus: stromal guides for T-cell development and selection. Nat. Rev. Immunol. 2006;6:127–135. - PubMed
    1. Alves NL, Richard-Le Goff O, Huntington ND, Sousa AP, Ribeiro VS, Bordack A, et al. Characterization of the thymic IL-7 niche in vivo. Proc. Natl. Acad. Sci. USA. 2009;106:1512–1517. - PMC - PubMed
    1. Park JH, Adoro S, Guinter T, Erman B, Alag AS, Catalfamo M, Kimura MY, et al. signalling by intrathymic cytokines, not T cell antigen receptors, specifies CD8 lineage choice and promotes the differentiation of cytotoxic-lineage T cells. Nat. Immunol. 2010;11:257–264. - PMC - PubMed

Publication types

MeSH terms

LinkOut - more resources