. 2012 May 1;520(7):1376-86.
doi: 10.1002/cne.22798.

Heterogeneity and dynamics of lateral line afferent innervation during development in zebrafish (Danio rerio)

Affiliations

Heterogeneity and dynamics of lateral line afferent innervation during development in zebrafish (Danio rerio)

Melanie Haehnel et al. J Comp Neurol. .

Abstract

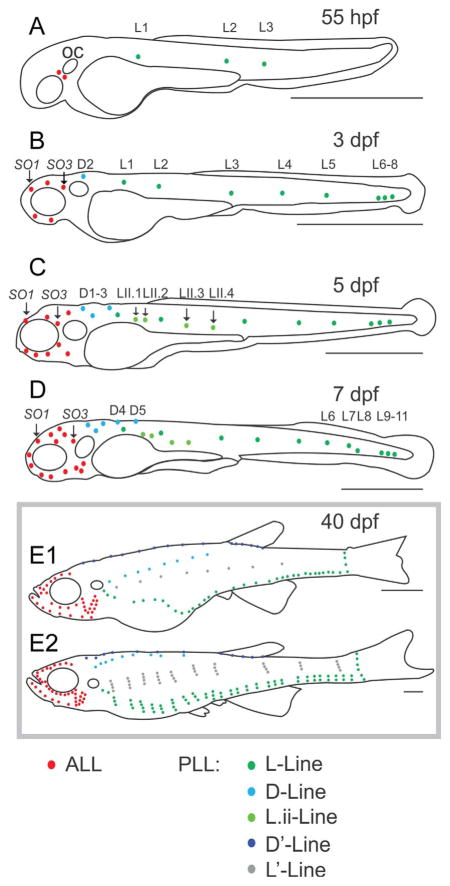
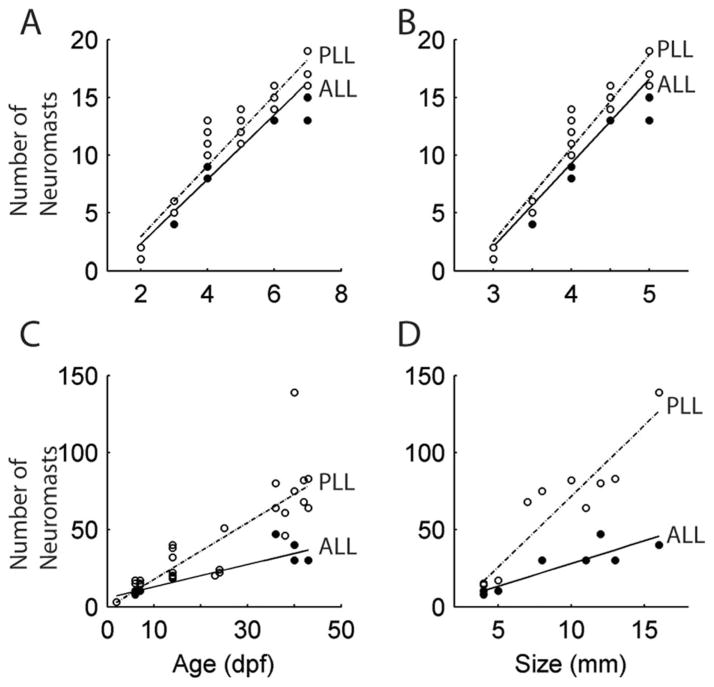
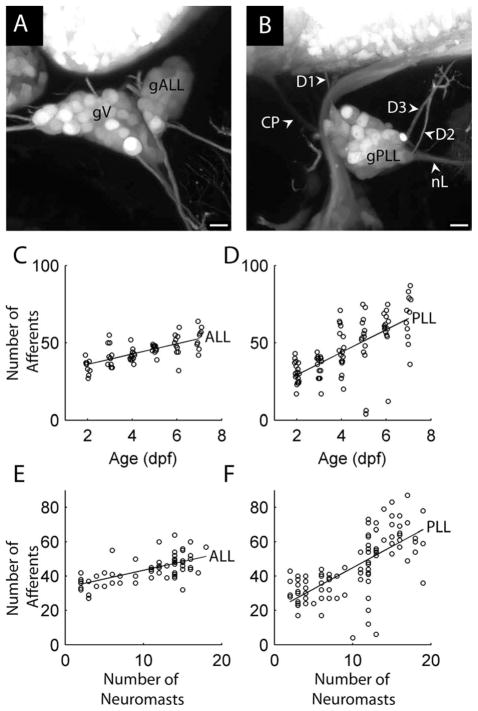
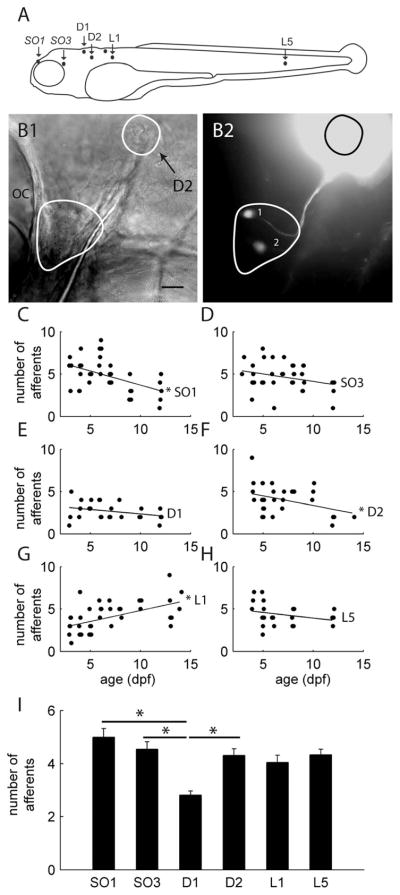
The lateral line system of larval zebrafish is emerging as a model to study a range of topics in neurobiology, from hair cell regeneration to sensory processing. However, despite numerous studies detailing the patterning and development of lateral line neuromasts, little is known about the organization of their connections to afferent neurons and targets in the hindbrain. We found that as fish grow and neuromasts proliferate over the body surface, the number of afferent neurons increases linearly. The number of afferents innervating certain neuromasts increases over time, while it decreases for other neuromasts. The ratio of afferent neurons to neuromasts differs between the anterior and posterior lateral line system, suggesting potential differences in sensitivity threshold or spatial resolution. A single afferent neuron routinely contacts a group of neuromasts, suggesting that different afferent neurons can convey information about receptive fields along the body. When afferent projections are traced into the hindbrain, where a distinct somatotopy has been previously described, we find that this general organization is absent at the Mauthner cell. We speculate that directional input from the lateral line is less important at an early age, whereas the speed of the escape response is paramount, and that directional responses arise later in development. By quantifying morphological connections in the lateral line system, this study provides a detailed foundation to understand how hydrodynamic information is processed and ultimately translated into appropriate motor behaviors.


Figures

Figure 1
Figure 1
Pattern of neuromast distribution in larval and juvenile zebrafish. A: At 55 hours postfertilization (hpf) the first neuromasts of the posterior lateral line (PLL, L1–3: green) and the anterior lateral line (ALL, red) appear. B: At 3 days postfertilization (dpf) there are eight neuromasts along the midline (L1–8). Note that the first dorsal neuromast to appear in the PLL is D2 (blue). The number of neuromasts in the ALL has increased (supraorbital neuromasts 1 and 3 are marked: SO1, SO3). C: At 5 dpf neuromasts derived from a second PLL-primordium develop (LII.1–4: light green) and are inserted between L1 and L2, as well as L3 and L4. There are three neuromasts in the dorsal branch of the PLL (D1 and D3). The number of ALL neuromasts has increased below the eye. D: At 7 dpf there are ≈15 lateral neuromasts in the PLL and five dorsal neuromasts. There are 14 neuromasts in the ALL. E: Simplified schematic of neuromast distribution in postlarval fish of the same age (40 dpf) but different size with different numbers of neuromasts. For example, an 8-mm long fish (E1) possesses much fewer neuromasts than a 16-mm long fish (E2). New lateral neuromasts have formed (L’ neuromasts: gray) above the original L-line. Neuromasts in the longer fish have proliferated to form dorsoventral stitches from the L’ and L neuromasts (Nuñez et al., 2009). New dorsal neuromasts have begun to form above the original D-line in both fish (D’ neuromasts: dark blue). Scale bars = 1 mm.
Figure 2
Figure 2
The number of neuromasts on the body increases in larvae and juveniles with age. A: In 2–7 dpf larvae the number of neuromasts increases linearly in the ALL (black circles, solid line) and the PLL (white circles, dashed line). Approximately three new neuromasts are added each day to the ALL and PLL; yALL = 2.8x −3.3, RALL2=0.95, pALL < 0.0001, yPLL = 3.1x − 3.2, RPLL2=0.93, pPLL < 0.0001 (n = 30). B: Neuromast number also increases as a function of body size. For each 1 mm increase in body size around seven neuromasts are added to the ALL and eight to the PLL; yALL = 7.2x − 19.7, RALL2=0.91, pALL < 0.0001, yPLL = 8.1x − 21.72, RPLL2=0.92, pPLL < 0.0001 (n = 30). Thus, for early stage larvae there is not much difference in age and size, so either can be used to predict neuromast number. In contrast, an analysis including older fish shows that age and size are not as well correlated. C: Neuromast proliferation until 43 dpf. The proliferation of neuromasts differs substantially between the ALL and PLL after the first few days of development because in older fish body size can differ greatly; yALL = 0.7x + 5.5, yPLL = 1.8x − 0.9, RALL2=0.8, pALL < 0.001, RPLL2=0.7, pPLL < 0.0001 (n = 22). D: Across a wider range of developmental stages, it becomes clear that body size is a better predictor than age for the number of PLL neuromasts on the body; yALL = 3.0x − 1.8, RALL2=0.8, pALL < 0.001, yPLL = 9.2x − 20.3, RPLL2=0.9, pPLL < 0.0001 (n = 9).
Figure 3
Figure 3
The number of afferent neurons relative to neuromasts increases during development. A: Confocal stack (≈60 μm) showing afferent neurons in the ALL ganglion (gALL) at 3 dpf; gV: trigeminal ganglion. Anterior is to the left and dorsal to the top. B: Confocal stack (≈60 μm) showing afferent neurons of the PLL ganglion (gPLL) at 3 dpf. Arrows indicate PLL-projections to dorsal neuromasts (D1, D2, and D3). nL, lateral branch of the PLL nerve that projects down the body; CP, central projections to hindbrain. C: The number of afferent neurons in the ALL ganglion plotted against fish age: y = 3.3x + 29.4, R2 = 0.5, P < 0.0001 (n = 65). D: Number of afferents in the PLL ganglion plotted against age: y = 7.34x + 14.4, R2 = 0.5, P < 0.0001 (n = 94). E: Number of afferent neurons plotted against the number of neuromasts for 2–7 dpf fish: y = 1.0x + 33.3, R2 = 0.4, P < 0.0001. F: Number of afferent neurons in the PLL ganglion plotted against the number of neuromasts for 2–7 dpf fish: y = 2.5x + 20.2, R2 = 0.5, P < 0.0001. Scale bars = 10 μm.
Figure 4
Figure 4
Variation in the number of afferent neurons that innervate selected neuromasts in the ALL and PLL. The number of neurons that contact a neuromast differs depending on the location of the neuromast on the body as well as the age of the fish. A: Schematic of those neuromasts backfilled to reveal afferent neurons that innervate them; L1, L5, D1, and D2 in the PLL system and SO1 and SO3 in the ALL system. B1: Differential interference contrast image showing the location of the D2 neuromast and the PLL ganglion (gPLL); OC, otic capsule. B2: Same image of B1 in fluorescence showing two afferent neurons innervating the D2 neuromast. C: The number of afferent neurons innervating the SO1 neuromast decreases significantly as fish develop from 3 to 12 dpf (y = −0.3x + 7.0, R2 = 0.24, P < 0.01, n = 36). D: The number of afferents innervating the SO3 neuromast do not change significantly (n = 37). E: The number of afferent neurons innervating the D1 neuromast does not significantly change between 3 and 12 dpf, n = 25. F: The number of afferent neurons innervating the D2 neuromast decreases significantly between 4 and 12 dpf, y = −0.2x + 5.6, R2 = 0.13, P < 0.05, n = 32. G: The number of afferents innervating the L1 neuromast increases significantly between 3 and 14 dpf, y = 0.3x + 2.3, R2 = 0.3, P < 0.001, n = 41. H: The number of afferents innervating the L5 neuromast does not change significantly between 4 and 12 dpf, n = 23. I: Bar graph shows mean number (±SEM) of afferent neurons across all ages (3–14 dpf) innervating each neuromast. There are significant differences between the D1 and the SO1, SO3, and the D2 as indicated by asterisks (one way-ANOVA, F = 4.47, df = 5, P < 0.001, Bonferroni post-hoc test). Note that the different age ranges selected for each neuromast reflect the earliest or latest point during development at which the neuromast can be reliably identified. Scale bar = 20 μm.
Figure 5
Figure 5
Lateral line afferent neurons send central projections into the hindbrain to contact the Mauthner cell in 5 dpf larvae. A: Dorsal schematic of the head corresponding to confocal stacks shown in B–E. The paired Mauthner cells are colored in green, the central projections of afferents innervating L1 or L5 in red, and the central projections of afferents innervating D2 in blue, as in the actual confocal images. The gray square outlines the area corresponding to panels B,C. B: The Mauthner cell (MC) and central projections of afferents (CP) innervating L1 and D2 are shown along with the PLL ganglion (gPLL). Square indicates region of detail in panel D. C: Central projections for L5 and D2. Square indicates region of detail in panel E. D: Afferent projections belonging to the L1 and D2 neuromast form putative contacts (arrow), with the lateral dendrite of the Mauthner cell. E: Afferent projections of the L5 and D2 intermingle less but also form putative contacts (arrow) with the lateral dendrite of the Mauthner cell. F: Lateral schematic of the head, where the gray square corresponds to panels G,H. G: Rotated view of the confocal stack in D, showing that afferent projections approach the lateral dendrite of the Mauthner cell (arrow). H: Rotated view of the confocal stack in E. Note that the central projections from L5 and D2 show a larger dorsoventral separation posterior to the point of contact (arrow) with the Mauthner cell. Scale bars = 20 μm in B; 5 μm in C–E,G,H.
Figure 6
Figure 6
Dorsoventral position of afferent central projections showing distributions and regions of overlap with the Mauthner cell in the hindbrain of 5 dpf larvae. A: Profile of normalized pixel area indicating the depth of afferent projections belonging to the D2 (blue) and L1 (red) neuromasts relative to the Mauthner cell (green). The largest areas of projection for afferents contacting the L1 and D2 neuromast occupy a similar depth region, as indicated by the overlap in peak pixel area. The predominant locations of these central projections lie more dorsally than the main body of the Mauthner cell. B: Profile of normalized pixel area indicating the depth of afferent projections belonging to the D2 and L5 neuromasts relative to the Mauthner cell. The largest area of projection for the D2 afferent lies more ventral than the L5 afferent, and is located closer to, and overlaps more substantially with, the Mauthner cell. C: There is no significant difference between the largest areas of projection for the L1 and D2 afferents and the Mauthner cell (n = 4, Wilcoxon signed rank test). D: For three of the four cells tested, the largest area of projection for the D2 is substantially closer to the Mauthner cell than for the L5. One of the projections shows the reverse trend, where the projection for the D2 is farther from the Mauthner cell than the L5.
Figure 7
Figure 7
Schematic of possible afferent neuron to neuromast innervation patterns. Each neuromast contains hair cells with two polarizations, indicated in black and white. Hair cells of one polarization are innervated by a distinct population of afferent neurons, while hair cells of the opposite polarization are innervated by a separate population of neurons (Nagiel et al., 2008). A: Since afferent neurons innervating neuromasts with a 1:1 ratio and there are equal numbers of afferents and neuromasts, then each neuromast must be innervated by at least two afferent neurons and every afferent must be innervating at least two neuromasts. B: Afferent neurons and neuromasts occur with a 2:1 ratio. In every neuromast, hair cells of one polarization are innervated by a “designated” afferent neuron. Innervations do not necessarily overlap. This innervation pattern was pattern was found for the D1 neuromast, which is innervated by two afferent neurons, which are not shared by other neuromasts. C: Afferent neurons and neuromasts occur with a 3:1 ratio or higher. In this case, a group of neuromasts must be innervated by more than two afferent neurons. Dotted lines indicate possible innervations by additional afferent neurons; however, other innervation combinations are possible. This innervation pattern, which has the potential for the most redundancy, was found early in development when many more afferent neurons than neuromasts are present. It also may represent the situation in the posterior lateral line system later in development, where three afferents are added for each neuromast and a given neuromast is, on average, innervated by 4–6 neurons.

Similar articles

Cited by

References

    1. Alexandre D, Ghysen A. Somatotopy of the lateral line projection in larval zebrafish. Proc Natl Acad Sci U S A. 1999;96:7558–7562. - PMC - PubMed
    1. Chiba A, Shepherd D, Murphey RK. Synaptic rearrangement during postembryonic development in the cricket. Science. 1988;240:901–905. - PubMed
    1. Corey DP, Hudspeth AJ. Ionic basis of the receptor potential in a vertebrate hair cell. Nature. 1979;281:675–677. - PubMed
    1. Cummings DM, Brunjes PC. The effects of variable periods of functional deprivation on olfactory bulb development in rats. Exp Neurol. 1997;148:360–366. - PubMed
    1. Faber DS, Korn H. Inputs from the posterior lateral line nerves upon the goldfish Mauthner cells. II. Evidence that the inhibitory components are mediated by interneurons of the recurrent collateral network. Brain Res. 1975;96:349–356. - PubMed

Publication types

LinkOut - more resources