

Rearrangement of the cone mosaic in the retina of the rat model of retinitis pigmentosa
- PMID: 22102145
- PMCID: PMC3934420
- DOI: 10.1002/cne.22800
Rearrangement of the cone mosaic in the retina of the rat model of retinitis pigmentosa
Abstract
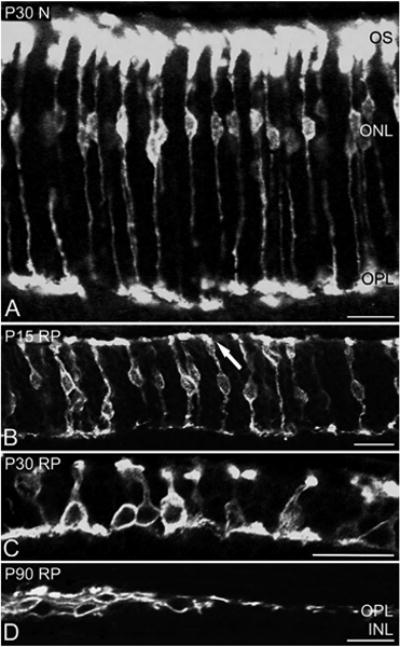
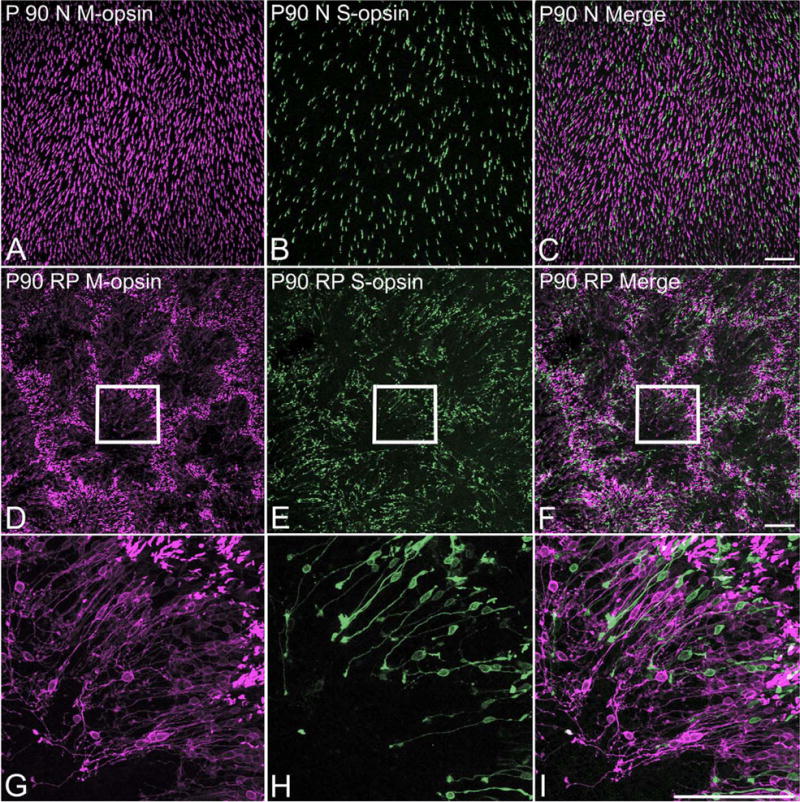
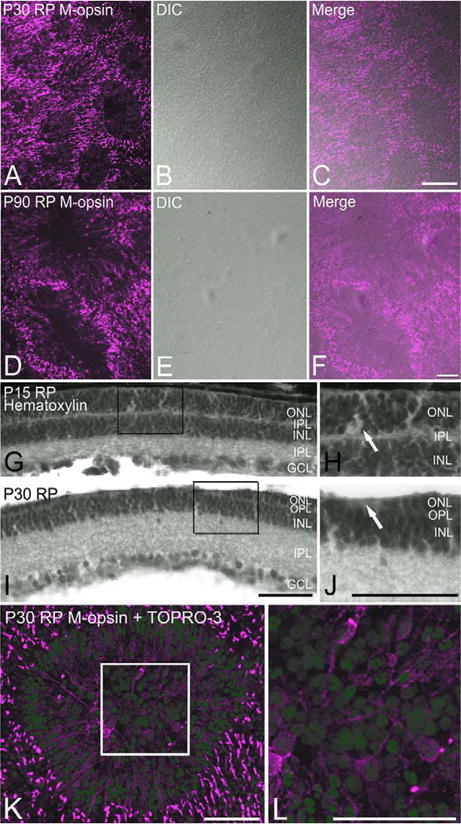
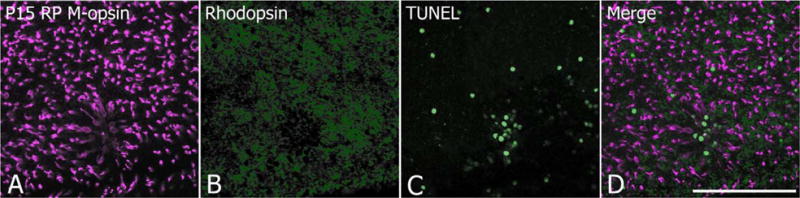
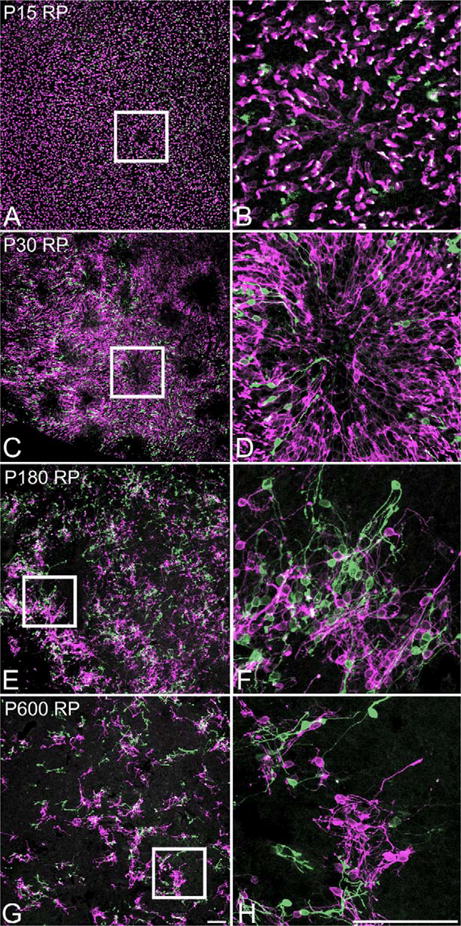
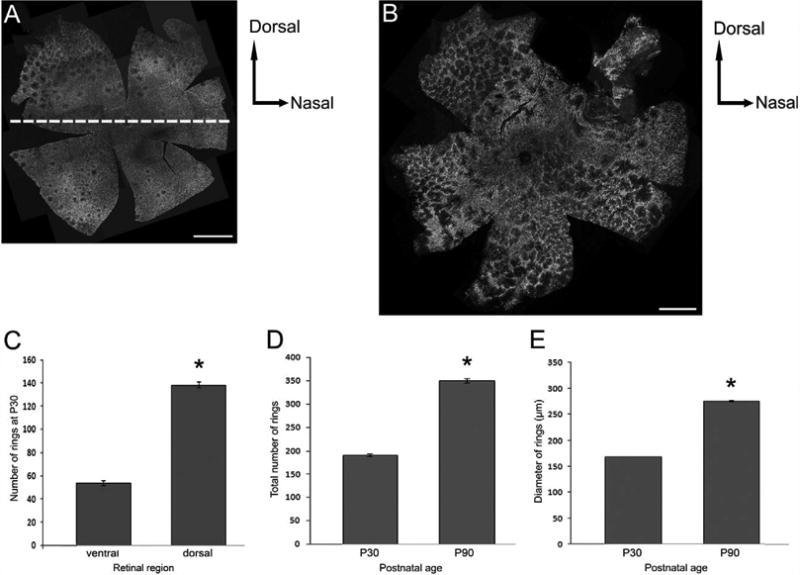
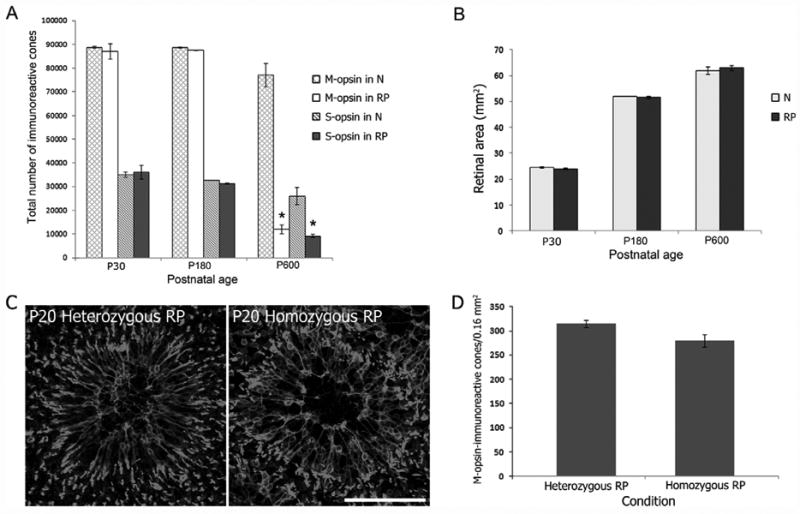
In retinitis pigmentosa (RP), the death of cones normally follows some time after the degeneration of rods. Recently, surviving cones in RP have been studied and reported in detail. These cones undergo extensive remodeling in their morphology. Here we report an extension of the remodeling study to consider possible modifications of spatial-distribution patterns. For this purpose we used S334ter-line-3 transgenic rats, a transgenic model developed to express a rhodopsin mutation causing RP. In this study, retinas were collected at postnatal (P) days P5-30, 90, 180, and P600. We then immunostained the retinas to examine the morphology and distribution of cones and to quantify the total cone numbers. Our results indicate that cones undergo extensive changes in their spatial distribution to give rise to a mosaic comprising an orderly array of rings. These rings first begin to appear at P15 at random regions of the retina and become ubiquitous throughout the entire tissue by P90. Such distribution pattern loses its clarity by P180 and mostly disappears at P600, at which time the cones are almost all dead. In contrast, the numbers of cones in RP and normal conditions do not show significant differences at stages as late as P180. Therefore, rings do not form by cell death at their centers, but by cone migration. We discuss its possible mechanisms and suggest a role for hot spots of rod death and the remodeling of Müller cell process into zones of low density of photoreceptors.
Copyright © 2011 Wiley Periodicals, Inc.
Figures
Similar articles
-
Role of Müller cells in cone mosaic rearrangement in a rat model of retinitis pigmentosa.Glia. 2011 Jul;59(7):1107-17. doi: 10.1002/glia.21183. Epub 2011 May 5. Glia. 2011. PMID: 21547953
-
Spatiotemporal pattern of rod degeneration in the S334ter-line-3 rat model of retinitis pigmentosa.Cell Tissue Res. 2013 Jan;351(1):29-40. doi: 10.1007/s00441-012-1522-5. Epub 2012 Nov 10. Cell Tissue Res. 2013. PMID: 23143675
-
Changes in the photoreceptor mosaic of P23H-1 rats during retinal degeneration: implications for rod-cone dependent survival.Invest Ophthalmol Vis Sci. 2013 Aug 28;54(8):5888-900. doi: 10.1167/iovs.13-12643. Invest Ophthalmol Vis Sci. 2013. PMID: 23908186
-
The effect of TIMP-1 on the cone mosaic in the retina of the rat model of retinitis pigmentosa.Invest Ophthalmol Vis Sci. 2014 Dec 16;56(1):352-64. doi: 10.1167/iovs.14-15398. Invest Ophthalmol Vis Sci. 2014. PMID: 25515575 Free PMC article.
-
A review of the mechanisms of cone degeneration in retinitis pigmentosa.Acta Ophthalmol. 2016 Dec;94(8):748-754. doi: 10.1111/aos.13141. Epub 2016 Jun 27. Acta Ophthalmol. 2016. PMID: 27350263 Review.
Cited by
-
ATF6 is required for efficient rhodopsin clearance and retinal homeostasis in the P23H rho retinitis pigmentosa mouse model.Sci Rep. 2021 Aug 11;11(1):16356. doi: 10.1038/s41598-021-95895-7. Sci Rep. 2021. PMID: 34381136 Free PMC article.
-
Phenotypic characterization of P23H and S334ter rhodopsin transgenic rat models of inherited retinal degeneration.Exp Eye Res. 2018 Feb;167:56-90. doi: 10.1016/j.exer.2017.10.023. Epub 2017 Nov 6. Exp Eye Res. 2018. PMID: 29122605 Free PMC article.
-
Protective effect of clusterin on rod photoreceptor in rat model of retinitis pigmentosa.PLoS One. 2017 Aug 2;12(8):e0182389. doi: 10.1371/journal.pone.0182389. eCollection 2017. PLoS One. 2017. PMID: 28767729 Free PMC article.
-
Genetically engineered pig models for human diseases.Annu Rev Anim Biosci. 2013 Jan;1:203-19. doi: 10.1146/annurev-animal-031412-103715. Epub 2013 Jan 3. Annu Rev Anim Biosci. 2013. PMID: 25387017 Free PMC article. Review.
-
Reshaping the Cone-Mosaic in a Rat Model of Retinitis Pigmentosa: Modulatory Role of ZO-1 Expression in DL-Alpha-Aminoadipic Acid Reshaping.PLoS One. 2016 Mar 15;11(3):e0151668. doi: 10.1371/journal.pone.0151668. eCollection 2016. PLoS One. 2016. PMID: 26977812 Free PMC article.
References
-
- Abe T, Sugano E, Saigo Y, Tamai M. Interleukin-1beta and barrier function of retinal pigment epithelial cells (ARPE-19): aberrant expression of junctional complex molecules. Invest Ophthalmol Vis Sci. 2003;44:4097–4104. - PubMed
-
- Baker GE, Dovey M, Davda P, Guibal C, Jeffery G. Protein kinase C immunoreactivity in the pigmented and albino rat retina. Eur J Neurosci. 2005;22:2481–2488. - PubMed
-
- Barhoum R, Martínez-Navarrete G, Corrochano S, Germain F, Fernandez-Sanchez L, de la Rosa EJ, de la Villa P, Cuenca N. Functional and structural modifications during retinal degeneration in the rd10 mouse. Neuroscience. 2008;155:698–713. - PubMed
-
- Berson EL. Retinitis pigmentosa. The Friedenwald Lecture. Invest Ophthalmol Vis Sci. 1993;34:1659–1676. - PubMed
Publication types
MeSH terms
Substances
Grants and funding
LinkOut - more resources
Full Text Sources
Miscellaneous
