. 2012 Jan;40(2):e12.
doi: 10.1093/nar/gkr995. Epub 2011 Nov 18.

GenomeView: a next-generation genome browser

Affiliations

GenomeView: a next-generation genome browser

Thomas Abeel et al. Nucleic Acids Res. 2012 Jan.

Abstract

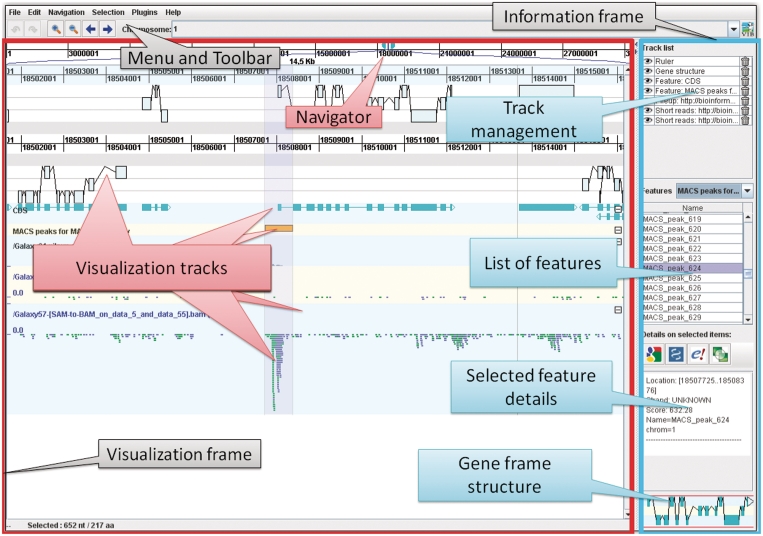
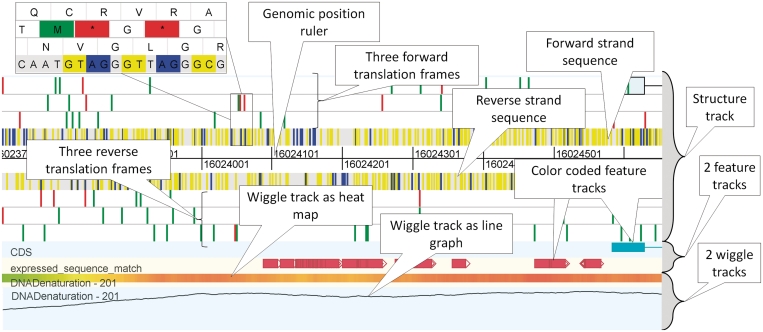
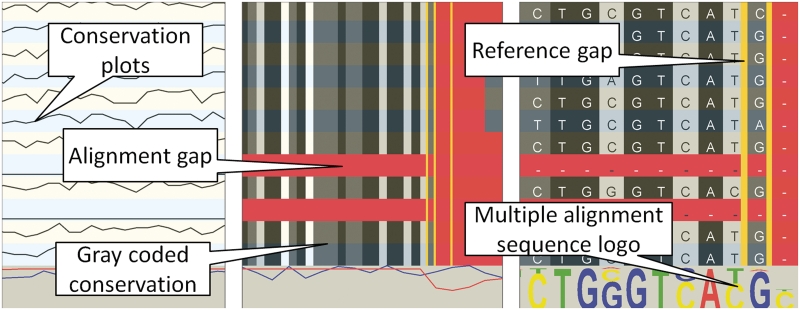
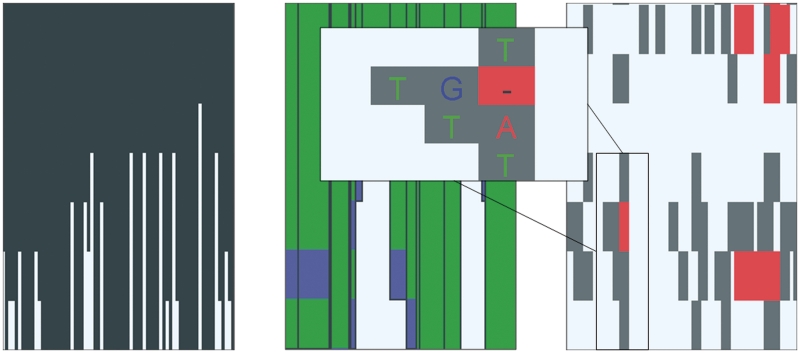
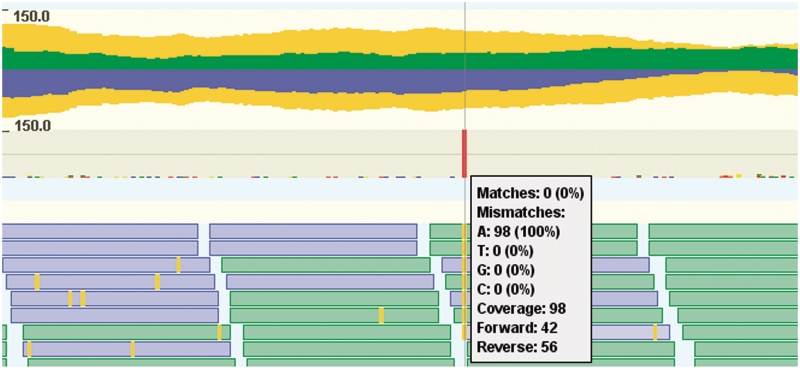
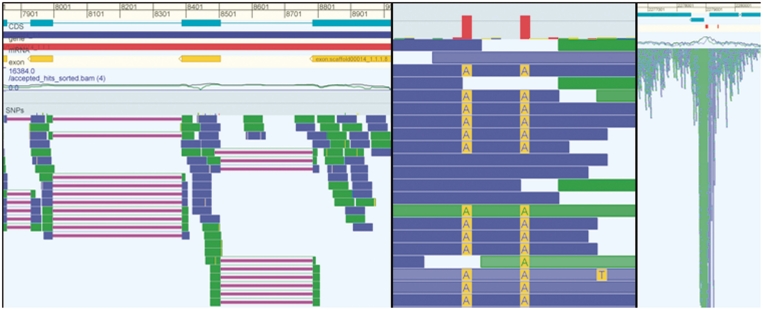
Due to ongoing advances in sequencing technologies, billions of nucleotide sequences are now produced on a daily basis. A major challenge is to visualize these data for further downstream analysis. To this end, we present GenomeView, a stand-alone genome browser specifically designed to visualize and manipulate a multitude of genomics data. GenomeView enables users to dynamically browse high volumes of aligned short-read data, with dynamic navigation and semantic zooming, from the whole genome level to the single nucleotide. At the same time, the tool enables visualization of whole genome alignments of dozens of genomes relative to a reference sequence. GenomeView is unique in its capability to interactively handle huge data sets consisting of tens of aligned genomes, thousands of annotation features and millions of mapped short reads both as viewer and editor. GenomeView is freely available as an open source software package.


Figures

Figure 1.
Figure 1.
Overview of the GUI layout of GenomeView. The top of the screen displays the menu and toolbar which provide access to all functions of GenomeView. The user interface is divided into two main frames with on the left the visualization frame and on the right the information frame. The visualization frame is further divided into a navigation bar at the top (indicated with ‘Navigator’), which allows users to quickly browse through the genome, and a large area that contains the various visualization tracks. The information frame contains four panels that provide management options and information about the data that is currently loaded. Navigation is entirely continuous, in contrast to step-wise navigation found in most other browsers. Furthermore, the zooming is semantic which means that the representation of the data changes according to zoom level and the amount of data on-screen.
Figure 2.
Figure 2.
Overview of some standard genome browser tracks. The structure track, which forms the upper part of the figure contains three forward and three reverse translation frames, as well as the forward and reverse strand sequence and the genomic ruler. In the structure track, start and stop codons and splice sites are indicated with a color (see inset for detailed zoom). Beneath the structure track there are two feature tracks that display annotation features using colored blocks. At the bottom of the figure there are two wiggle tracks, one depicted as heat map, the other as a line graph. The data in this figure is part of human chromosome 21, release hg18.
Figure 3.
Figure 3.
Overview of the basic multiple alignment track. Each line represents another organism. The left panel shows a large area and the multiple alignment tracks show conservation plots between the aligned sequence and the reference. When zooming in (the two rightmost panels), the conservation over the organisms is gray-coded in each track (black=100%, dark gray >75%, light gray >50% and white <50% conservation). Gaps in the aligned sequence are indicated in red, gaps in the reference are indicated with vertical yellow lines. The rightmost zoom is down to the nucleotide level and shows a sequence logo for each position in the alignment.
Figure 4.
Figure 4.
Overview of the advanced multiple alignment track for large genomes. At a high-level perspective (left panel) the histogram-like plot shows the number of segments that align to the corresponding region in the reference genome. Essentially, this is a conservation plot. When zooming in, more details emerge (center panel). The height of the block is still relative to the number of species that contain that particular alignment block. The colors of the lines in each alignment block indicate the strand used in the alignment. Blue segments are aligned to the reverse strand, while green segments are mapped to the forward strand. When hovering over the block, a pop-up will appear that shows the organism name for each line in the alignment block. Zooming in further will provide more detailed information on the multiple alignments (right panel). At this level, mismatches are indicated with gray blocks and gaps with red blocks. When zooming in even further (inset), the gray blocks will contain the letter of the mismatched nucleotide in the aligned organism.
Figure 5.
Figure 5.
Overview of the short-read visualization track. This track shows the alignment of individual reads. Green and blue indicate reads mapping to the forward and reverse strand respectively. Purple lines are used to connect paired-end reads (left panel), or two parts of a read that has been aligned over a splice-junction (center panel). Yellow indicates mismatches between the read and the reference genome. Black and red are used to indicate indels (right panel). The brightness of the color of a read indicates the mapping quality assigned by the mapping software used in producing this short-read alignment. The lighter a read, the lower the mapping quality. In case of paired-end sequencing there is a second color scheme (not shown) to indicate directionality of the read.
Figure 6.
Figure 6.
Overview of the pileup visualization track. This track consists of two parts: the top part is a read coverage plot, while the bottom part shows the consensus sequence summary of individual nucleotides. The read coverage plot consists of three plots, one for the reads mapping to the forward (green, above central axis), one for the reverse strand (blue, belows central axis) and one for the total coverage (yellow, mirrored above and below the central axis). The second part of the pile up track provides a more detailed view that displays a summary of the individual nucleotides as colored bar charts. Centrally in the figure, there is one red bar, indicating a single nucleotide polymorphism (SNP). This is confirmed by hovering the mouse over the pileup track, which gives a textual summary of the coverage and nucleotide frequencies. There are some reads (blue and green boxes) from the short-read track at the bottom of the figure overlapping with the pop-up with detailed information.
Figure 7.
Figure 7.
The three panels in this figure show examples for different data types. The left panel shows a eukaryote genome with RNA-seq data. The reads in this RNA-seq experiment have been aligned with gaps (purple lines) and it is clear that many reads identify/confirm the splice junctions of the annotated CDS (cyan). The middle panel shows data from a resequencing project and shows a detailed view of two SNPs. The right panel shows data from a ChIP-seq experiment and it is obvious that the peak in the mapped sequencing data corresponds to the annotated binding sites (red blocks right above the coverage graph).

Similar articles

Cited by

References

    1. Hawkins RD, Hon GC, Ren B. Next-generation genomics: an integrative approach. Nat. Rev. Genet. 2010;11:476–486. - PMC - PubMed
    1. Marguerat S, Wilhelm BT, Bhler J. Next-generation sequencing: applications beyond genomes. Biochem. Soc. Trans. 2008;36(Pt 5):1091–1096. - PMC - PubMed
    1. Schuster SC. Next-generation sequencing transforms today's biology. Nat. Methods. 2008;5:16–18. - PubMed
    1. Metzker ML. Sequencing technologies - the next generation. Nat. Rev. Genet. 2010;11:31–46. - PubMed
    1. Qin J, Li R, Raes J, Arumugam M, Burgdorf KS, Manichanh C, Nielsen T, Pons N, Levenez F, Yamada T, et al. A human gut microbial gene catalogue established by metagenomic sequencing. Nature. 2010;464:59–65. MetaHIT Consortium. - PMC - PubMed

Publication types