

Stochastic delay accelerates signaling in gene networks
- PMID: 22102802
- PMCID: PMC3213172
- DOI: 10.1371/journal.pcbi.1002264
Stochastic delay accelerates signaling in gene networks
Abstract
The creation of protein from DNA is a dynamic process consisting of numerous reactions, such as transcription, translation and protein folding. Each of these reactions is further comprised of hundreds or thousands of sub-steps that must be completed before a protein is fully mature. Consequently, the time it takes to create a single protein depends on the number of steps in the reaction chain and the nature of each step. One way to account for these reactions in models of gene regulatory networks is to incorporate dynamical delay. However, the stochastic nature of the reactions necessary to produce protein leads to a waiting time that is randomly distributed. Here, we use queueing theory to examine the effects of such distributed delay on the propagation of information through transcriptionally regulated genetic networks. In an analytically tractable model we find that increasing the randomness in protein production delay can increase signaling speed in transcriptional networks. The effect is confirmed in stochastic simulations, and we demonstrate its impact in several common transcriptional motifs. In particular, we show that in feedforward loops signaling time and magnitude are significantly affected by distributed delay. In addition, delay has previously been shown to cause stable oscillations in circuits with negative feedback. We show that the period and the amplitude of the oscillations monotonically decrease as the variability of the delay time increases.
Conflict of interest statement
The authors have declared that no competing interests exist.
Figures
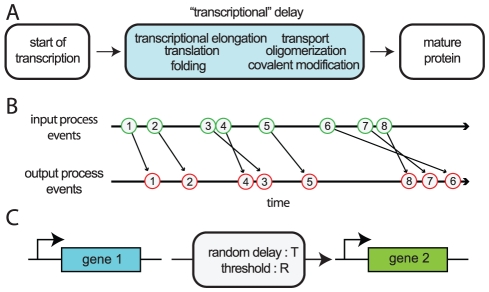
 , and the number of transcription factors needed to overcome the threshold of gene 2,
  .
.
 and
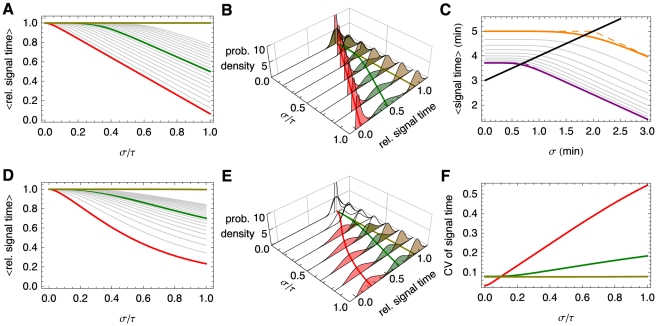
and  with equal probability, the mean signaling time decreases with increasing variability in delay time, Eq. (8). Shown are the signaling times (normalized by the time at
  ), versus CV of the delay time for signaling threshold values from
  (red), through
  (green) to
  in steps of 1. Here
  and
and  . When
  (brown) increasing randomness in delay time has little effect on the mean. (B) Same as panel (A) but with the probability distribution,
  , for different values of
  . (C) The transition from the small
  regime to the large
  regime occurs when
  . Here we fix
  and between the different curves vary
  from
from  (magenta) to
  (orange) in steps of 1. Dashed lines show the asymptotic approximations, Eqs. (9) and (10), which meet at the black line. Panels (D) and (E) are equivalent to panels (A) and (B), with
  following a gamma distribution,
  , and
, and  . (F) The coefficient of variation of the signaling time,
  , as a function of
  .
.
 ) and mean delay time (
 ). The random time between the initiation of transcription of gene
  to the full formation of a total of
  proteins
  is denoted
  , which is an implicit function of
  .
.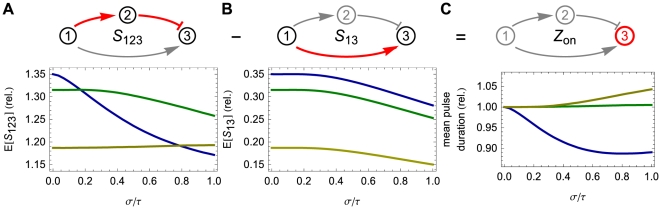
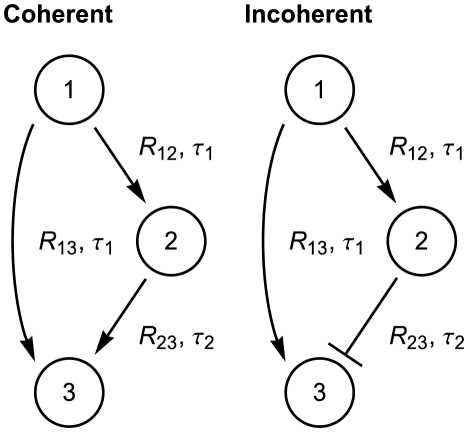
 . (A) Bottom: The expected value of signaling time as a function of the relative standard deviation of the delay time. (B) Top: The shorter pathway is simply the signaling of the first gene to the third. (B) Bottom: Expected signaling time,
  . (C) Top: The output pulse is determined by the amount of time gene
  is actively transcribing. This time is simply the difference of the longer path duration (
 ) and the shorter path duration (
 ). (C) Bottom: Depending on the thresholds
  ,
,  , and
, and  , the expected pulse duration can either increase or decrease as a function of the delay variability. In each of the three plots, the data on the vertical axis are presented relative to the mean pulse duration at
  . Here, the colored lines correspond to
  (blue),
  (green), and
  (brown), while
  ,
,  . In addition, the protein degradation rates are each
  , all delays are gamma distributed with mean
  .
.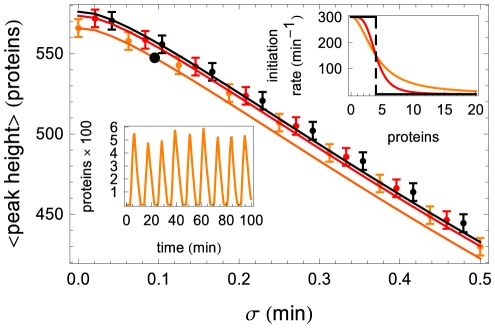
 (orange),
  (red), and
  (i.e. step function, black). The top inset shows the shape of the Hill function for the three values of
  , with colors matching those in the main figure. The lower inset shows one realization of the oscillator at parameter values corresponding to the large black circle on the orange (
 ) curve of the main figure. The average and the standard deviation of the peak heights were calculated from stochastic simulations of
  oscillations. Here
  ,
,  ,
,  ,
,  and
and  .
.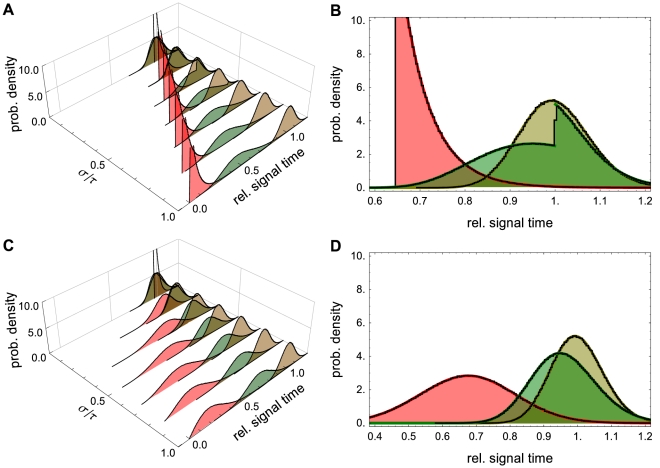
 from Example with
  . The PDFs in red correspond to signal threshold value
  , green to
  and brown to
  . Here
  and
and  . (B) A 2D view of panel (A) with
  . Solid lines show analytical results which are nearly indistinguishable from those obtained through stochastic simulation (black lines). Note that the discontinuity in the green curve is due to the discrete nature of the Bernoulli delay distribution. The CDF,
  , has jump discontinuities that, in light of Eq. (18), produce jump discontinuities in the signaling time PDF. The discontinuity is apparent in both the theoretical prediction (green line) and the stochastic simulations (black line). Panels (C) and (D) are equivalent to panels (A) and (B) with
  following a gamma distribution. The PDFs were discretized over 200 bins using
  trials.
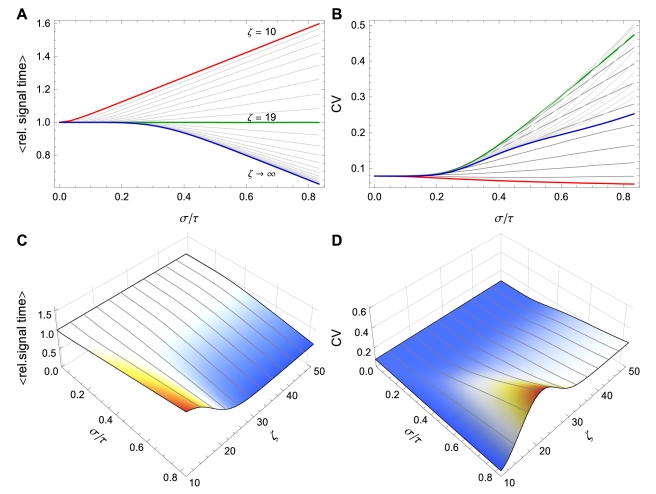
 can increase or decrease as a function of
  depending on the value of
  . Here
  . (A)
. (A)  vs. CV of
  for
for  varying from
  (red) to
  (green) to
  (blue) using the Bernoulli delay distribution
  in Example with
  . Note the transition that occurs at
  . (B) Equivalent to (A), but plotting CV of the signaling time instead of conditional expectation. (C) and (D) Contour plots corresponding to (A) and (B), respectively. Notice that for fixed
  , signaling time CV can change non-monotonically with
  . For instance, at
  , signaling time CV starts low (red), increases to
  (green) and then decreases thereafter. Plots were obtained through stochastic simulation with
  trials.
References
-
- Jacob F, Monod J. Genetic regulatory mechanisms in synthesis of proteins. J Mol Biol. 1961;3:318–356. - PubMed
-
- Alon U. Network motifs: theory and experimental approaches. Nat Rev Genet. 2007;8:450–461. - PubMed
-
- De Jong H. Modeling and simulation of genetic regulatory systems: a literature review. J Comp Biol. 2002;9:67–103. - PubMed
-
- Kærn M, Blake WJ, Collins JJ. The engineering of gene regulatory networks. Annu Rev Biomed Eng. 2003;5:179–206. - PubMed
-
- Gillespie DT. Exact stochastic simulation of coupled chemical reactions. J Phys Chem. 1977;81:2340–2361.
Publication types
MeSH terms
LinkOut - more resources
Full Text Sources
