. 2011;6(11):e27288.
doi: 10.1371/journal.pone.0027288. Epub 2011 Nov 10.

An RNA-Seq strategy to detect the complete coding and non-coding transcriptome including full-length imprinted macro ncRNAs

Affiliations

An RNA-Seq strategy to detect the complete coding and non-coding transcriptome including full-length imprinted macro ncRNAs

Ru Huang et al. PLoS One. 2011.

Abstract

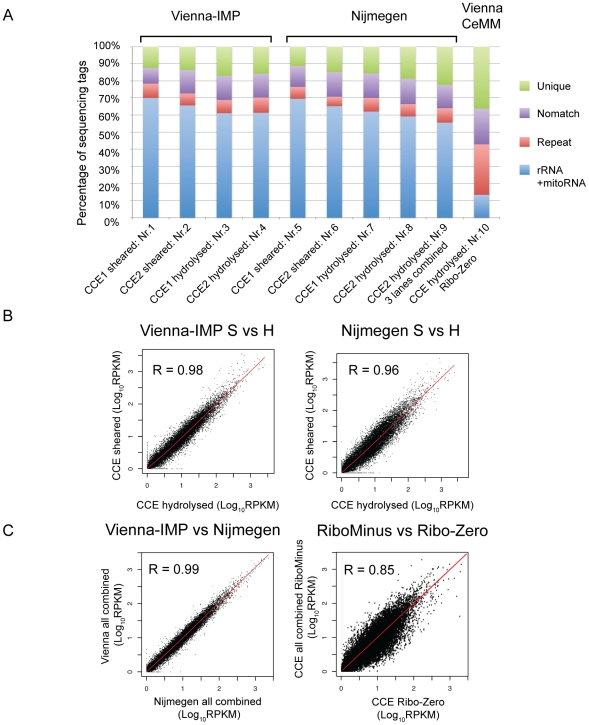
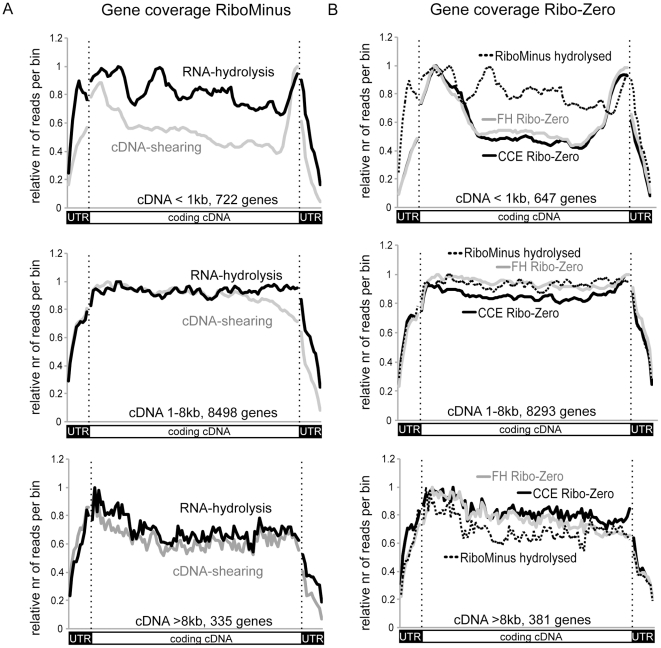
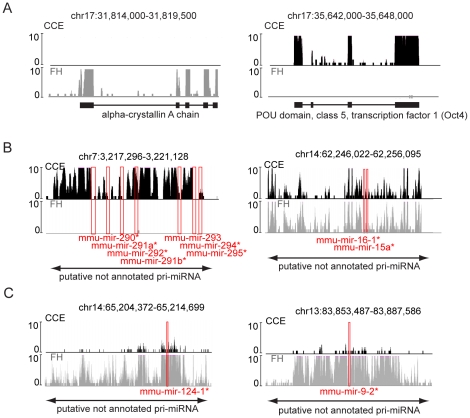
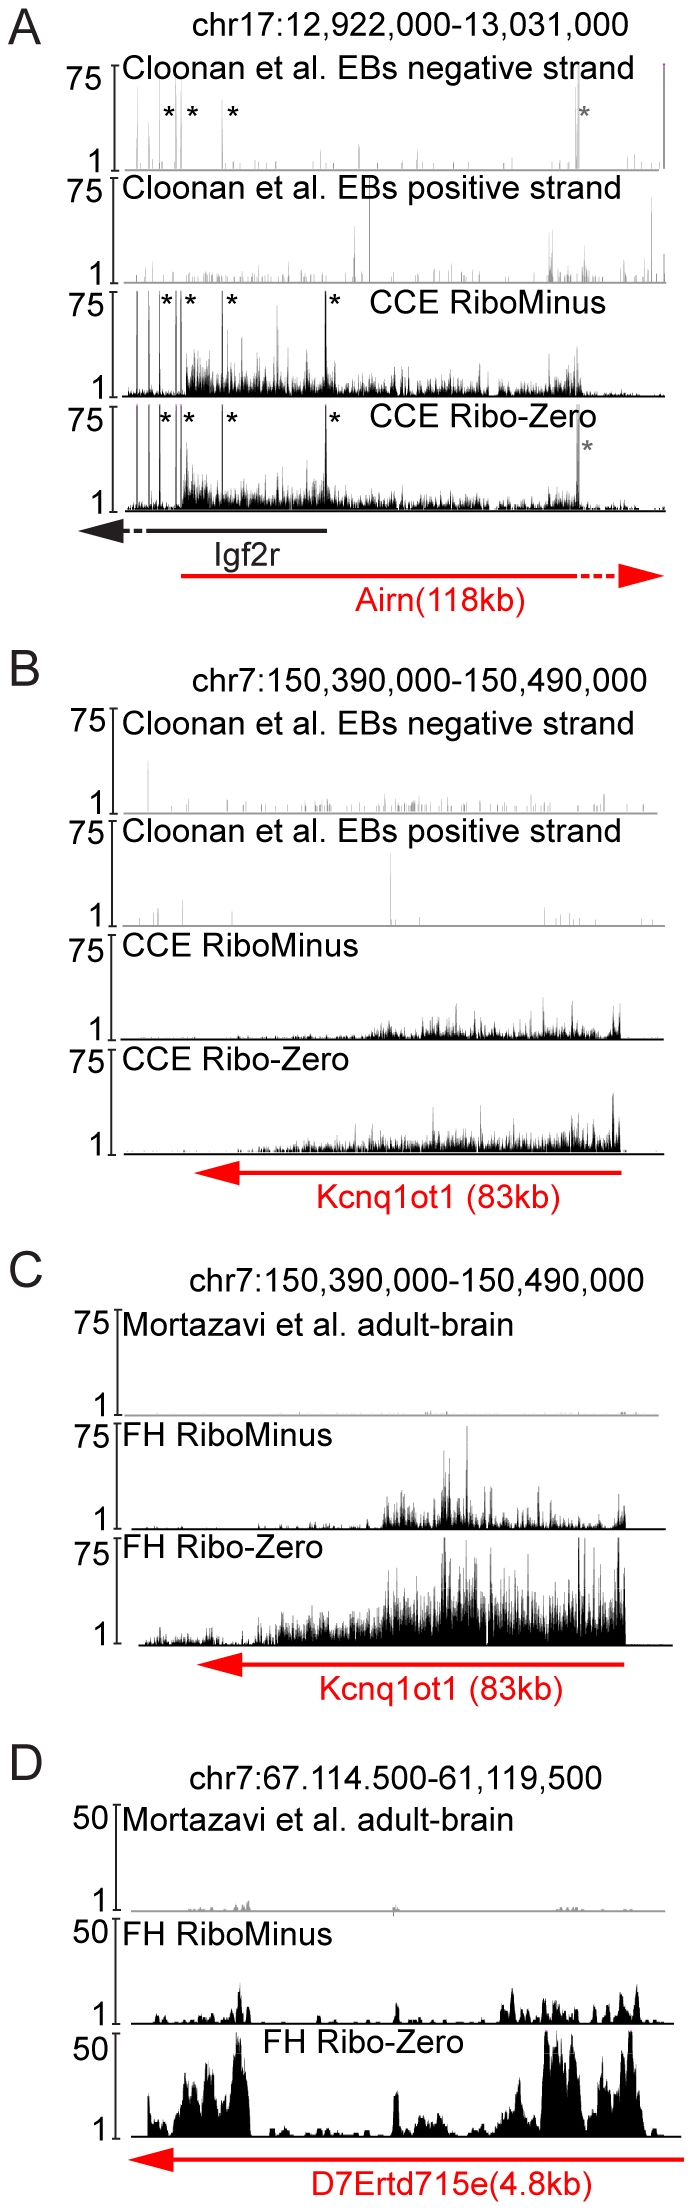
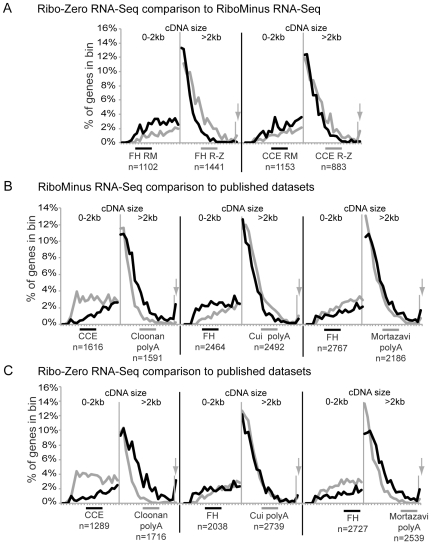
Imprinted macro non-protein-coding (nc) RNAs are cis-repressor transcripts that silence multiple genes in at least three imprinted gene clusters in the mouse genome. Similar macro or long ncRNAs are abundant in the mammalian genome. Here we present the full coding and non-coding transcriptome of two mouse tissues: differentiated ES cells and fetal head using an optimized RNA-Seq strategy. The data produced is highly reproducible in different sequencing locations and is able to detect the full length of imprinted macro ncRNAs such as Airn and Kcnq1ot1, whose length ranges between 80-118 kb. Transcripts show a more uniform read coverage when RNA is fragmented with RNA hydrolysis compared with cDNA fragmentation by shearing. Irrespective of the fragmentation method, all coding and non-coding transcripts longer than 8 kb show a gradual loss of sequencing tags towards the 3' end. Comparisons to published RNA-Seq datasets show that the strategy presented here is more efficient in detecting known functional imprinted macro ncRNAs and also indicate that standardization of RNA preparation protocols would increase the comparability of the transcriptome between different RNA-Seq datasets.


Conflict of interest statement

Competing Interests: The authors have declared that no competing interests exist.

Figures

Figure 1
Figure 1. Optimisation and reproducibility of ribo-depleted RNA-Seq.
(A) Distribution of different sequence tag types from RNA prepared from CCE differentiated ES cells subject to ribosomal RNA depletion using either the RiboMinus or the Ribo-Zero Kit and fragmented either by RNA-hydrolysis or by cDNA-shearing. Sequencing was performed in two different sequencing locations (Vienna-IMP, Nijmegen, RiboMinus) or in one sequencing location (Vienna-CeMM, Ribo-Zero). The percentage of tags in each category is shown for two technical sequencing replicates (CCE1, CCE2) of material prepared by RiboMinus and cDNA-shearing (sheared, lanes nr. 1,2,5,6) or RiboMinus and RNA-hydrolysis (hydrolysed, lanes nr. 3,4,7,8), for the combination of three technical sequencing replicates of RiboMinus and RNA-hydrolysis (lane nr. 9) and for one sequencing of Ribo-Zero and RNA-hydrolysis (lane nr. 10). green: unique tags matching only once in the genome; blue: rRNA+mitoRNA tags matching to ribosomal (RiboMinus and Ribo-Zero) or mitochondrial (RiboMinus) RNAs; red: repeat tags matching more than once in the genome; purple: nomatch tags do not match to the genome. (B) Scatter plots comparing the RPKM (Reads Per Kilobase of exon model per Million of reads) transcription levels of RefSeq protein-coding genes between combined tags from RiboMinus and RNA-hydrolysis (H) and RiboMinus and cDNA-shearing (S) from CCE within the same location: Vienna-IMP (left) and Nijmegen (right). (C) Scatter plots as in B comparing RPKM transcript levels of all combined tags from the two sequencing locations (Vienna-IMP and Nijmegen, left) or between the combined RiboMinus data and the Ribo-Zero data (right). R: Pearson's correlation, note that a perfect correlation is R = 1.
Figure 2
Figure 2. Tag coverage of genes differs between fragmentation methods and ribosomal RNA depletion methods.
The coverage of genes with sequence tags is shown as the normalized number of tags at relative positions throughout the gene length. UTRs and coding exons were analysed separately and are plotted as 10 bins for 5′UTRs and 3′UTRs and 100bins for the coding exons (separated by vertical dotted line). (A) Comparison of the coverage in the RiboMinus dataset for the combined tags of CCE and FH from RNA-hydrolysis (black) and cDNA-shearing (grey). (B) Comparison of the coverage in the RNA-hydrolysis RiboMinus dataset (dotted line, same as in A) and in Ribo-Zero dataset plotted separately for CCE (black) and FH (grey). For all analyses the genes were separated into three groups according to their cDNA length (coding exons and 5′ and 3′ UTRs) as indicated.
Figure 3
Figure 3. Ribo-depleted RNA-Seq reliably detects expression of known protein-coding and non-coding genes.
(A) Saturation curves showing the percentage of RefSeq protein-coding genes (left) or RefSeq ncRNAs (right) with an RPKM+/−5% of the final RPKM for the combined CCE RiboMinus dataset (calculated at the maximum tag number) at different sequencing depths crated by randomly picking the indicated number of tags (M: million). The lines show three groups of genes with similar RPKM expression levels. Error bars indicate the minimum and maximum of ten random tag sets. If the curves reach a plateau before the final number of tags, this indicates that this gene group was sequenced exhaustively, as obtaining more tags does not change their RPKM. The large error bars originate from small gene numbers in the categories, where a small number of changed genes results in a large relative change. (B) As in A for the FH Ribo-Zero dataset.
Figure 4
Figure 4. Ribo-depleted RNA-Seq detects tissue specific expression of known protein-coding and non-coding genes.
(A) UCSC genome browser (http://genome.ucsc.edu/, mm9) screen shots of RNA-Seq data for CCE (black, top) and FH (grey, bottom). The genome position is given on top, black or grey bars indicate the number of sequence tags (tag numbers >10 are cut off) at this position. The position of RefSeq genes (black line) with exons (black boxes), are shown below with the gene name. Left: the alpha-crystallin A chain gene is specific for the mouse eye and therefore sequence tags over exons (indicating gene expression) are only found in FH and are absent from CCE. Right: the well-known stem cell marker Pou5f1 (Oct4) shows sequence tags over exons only in CCE but not in FH. (B) Putative pri-miRNAs indicating either the specific expression of all miRNAs of the cluster in CCE and the >10 fold reduced expression in FH (left) or the similar expression of the two miRNAs in the region in CCE and FH (right). Red boxes indicate the position of annotated miRNAs (http://genome.ucsc.edu/, mm9) with the name given below. Asterisks mark miRNAs overlapped by a low number of sequence tags. The position of the putative pri-miRNA, not annotated in the RefSeq database, is shown at the bottom by a double-headed arrow. Details as in (A). (C) Putative pri-miRNAs indicating the >10 fold increased expression of the single miRNAs of the respective cluster in FH compared to CCE. Details as in (A). Note that in A, B, and C RiboMinus data is shown and that the Ribo-Zero data produced similar results (data not shown).
Figure 5
Figure 5. Ribo-depleted RNA-Seq detects macro ncRNAs more efficiently than polyA RNA-Seq.
(A) UCSC genome browser screen shot as in Figure 4A of the Airn macro ncRNA gene. The Cloonan et al. EB polyA RNA-Seq (grey, top), the RiboMinus CCE and Ribo-Zero CCE RNA-Seq data (black, bottom) are shown. Black asterisks mark the signals from the protein-coding mRNA Igf2r and grey asterisks mark the position of a pseudogene expressed from chr.15 . Note that the ncRNA Airn is 118 kb in length (red arrow, extends outside the region shown) and overlaps exons 2 and 1 protein-coding Igf2r gene (black arrow, extends outside the region shown) in antisense orientation. Therefore Airn and Igf2r signals are visible in the CCE data that has no strand-specific information. For Cloonan et al., strand-specific information was available and Igf2r signals are visible on the negative strand (black asterisks, top) whereas only a low amount of signals are visible on the positive strand expressing Airn. (B) As in A showing the functional 83 kb Kcnq1ot1 macro ncRNA (red arrow). (C) As in B showing Mortazavi et al. adult mouse brain polyA RNA-Seq (grey, top), the RiboMinus FH (black, middle) and Ribo-Zero FH RNA-Seq data (black, bottom). (D) As in C showing an annotated RefSeq ncRNA of unknown function. Signals higher than indicated by the scale on the x-axis were cut off. Note that the differences in the read numbers between RiboMinus FH and Ribo-Zero FH reflect the increased number of uniquely aligned tags (see Table S1).
Figure 6
Figure 6. The template preparation protocol determines the comparability of ribo-depleted RNA-Seq to polyA RNA-Seq.
The cDNA size distribution of genes showing more than 8× expression difference (Figure S2), in the comparison of (A) FH RiboMinus - FH-RiboZero (left) and CCE RiboMinus - CCE Ribo-Zero (right). (B) as in A for the comparisons of CCE RiboMinus-Cloonan et al. EB (left), FH RiboMinus-Cui et al. adult mouse brain polyA (middle) and FH RiboMinus-Mortazavi et al. adult mouse brain polyA (right). (C) as in A for the comparisons of CCE Ribo-Zero-Cloonan et al. EB (left), FH Ribo-Zero-Cui et al. adult mouse brain polyA (middle) and FH Ribo-Zero-Mortazavi et al. adult mouse brain polyA (right). For Cloonan et al. EB both the gene expression data from the published alignment (shown in B, C, see Materials and methods) and from an alignment done with the pipeline used here (data not shown) were used and produced the same highly significant differences. Two different size classes are shown with different bin sizes (0–2 kb, 100 bp bins and >2 kb, 500 bp bins). Genes bigger than 11.5 kb are grouped in the last bin (arrow).

References

    1. Carninci P, Kasukawa T, Katayama S, Gough J, Frith MC, et al. The transcriptional landscape of the mammalian genome. Science. 2005;309:1559–1563. - PubMed
    1. Kapranov P, Cawley SE, Drenkow J, Bekiranov S, Strausberg RL, et al. Large-scale transcriptional activity in chromosomes 21 and 22. Science. 2002;296:916–919. - PubMed
    1. Katayama S, Tomaru Y, Kasukawa T, Waki K, Nakanishi M, et al. Antisense transcription in the mammalian transcriptome. Science. 2005;309:1564–1566. - PubMed
    1. Mattick JS, Taft RJ, Faulkner GJ. A global view of genomic information–moving beyond the gene and the master regulator. Trends in genetics : TIG. 2010;26:21–28. - PubMed
    1. Zamore PD. Somatic piRNA biogenesis. EMBO J. 2010;29:3219–3221. - PMC - PubMed

Publication types