Comparative Study
. 2011;6(11):e27445.
doi: 10.1371/journal.pone.0027445. Epub 2011 Nov 15.

Altered islet composition and disproportionate loss of large islets in patients with type 2 diabetes

Affiliations
Comparative Study

Altered islet composition and disproportionate loss of large islets in patients with type 2 diabetes

German Kilimnik et al. PLoS One. 2011.

Abstract

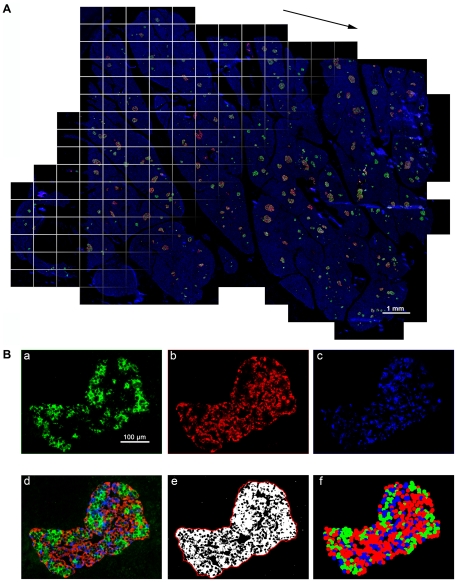
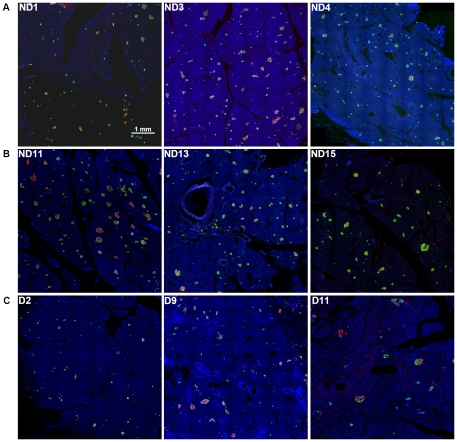
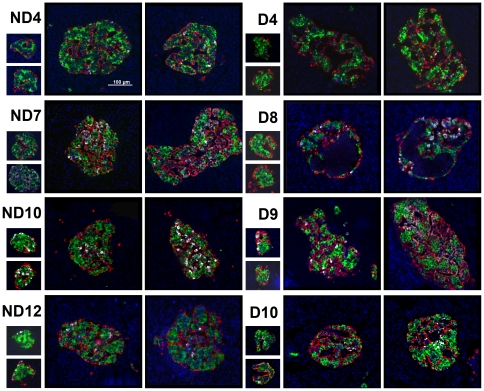
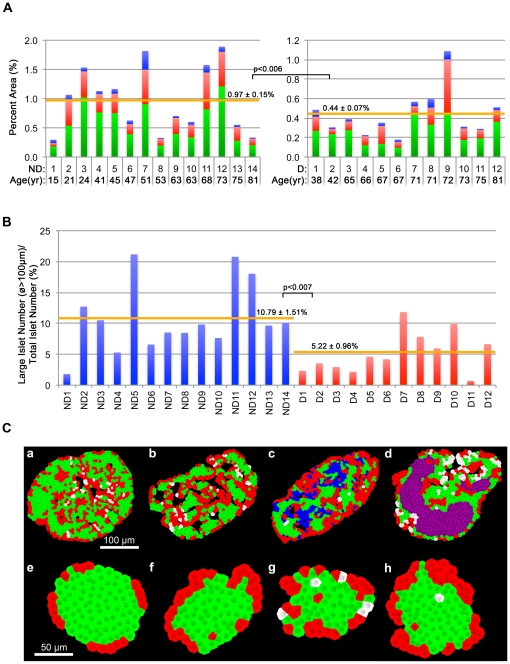
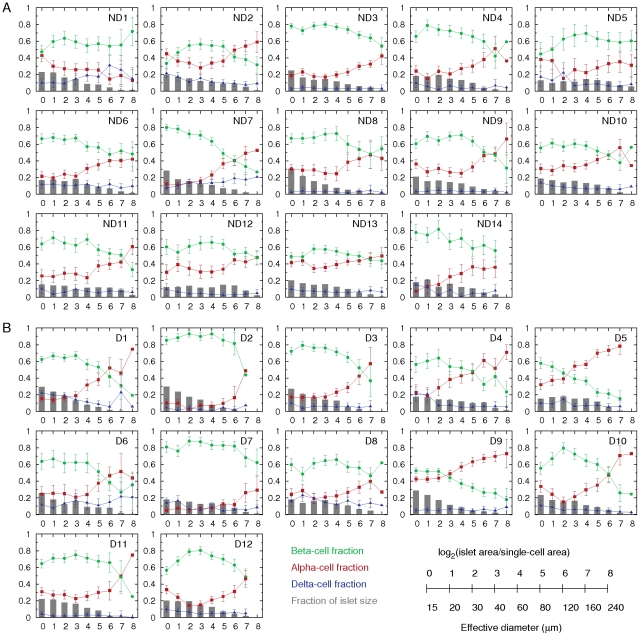
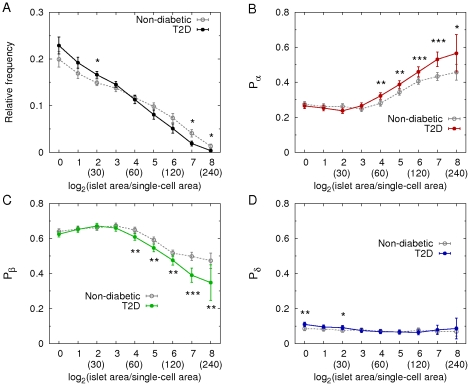
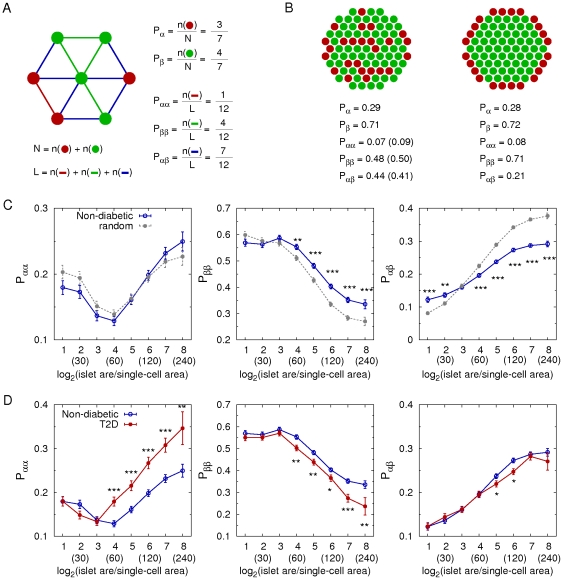
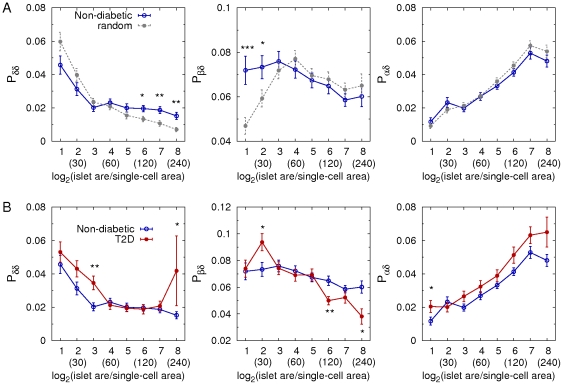
Human islets exhibit distinct islet architecture with intermingled alpha- and beta-cells particularly in large islets. In this study, we quantitatively examined pathological changes of the pancreas in patients with type 2 diabetes (T2D). Specifically, we tested a hypothesis that changes in endocrine cell mass and composition are islet-size dependent. A large-scale analysis of cadaveric pancreatic sections from T2D patients (n = 12) and non-diabetic subjects (n = 14) was carried out combined with semi-automated analysis to quantify changes in islet architecture. The method provided the representative islet distribution in the whole pancreas section that allowed us to examine details of endocrine cell composition in individual islets. We observed a preferential loss of large islets (>60 µm in diameter) in T2D patients compared to non-diabetic subjects. Analysis of islet cell composition revealed that the beta-cell fraction in large islets was decreased in T2D patients. This change was accompanied by a reciprocal increase in alpha-cell fraction, however total alpha-cell area was decreased along with beta-cells in T2D. Delta-cell fraction and area remained unchanged. The computer-assisted quantification of morphological changes in islet structure minimizes sampling bias. Significant beta-cell loss was observed in large islets in T2D, in which alpha-cell ratio reciprocally increased. However, there was no alpha-cell expansion and the total alpha-cell area was also decreased. Changes in islet architecture were marked in large islets. Our method is widely applicable to various specimens using standard immunohistochemical analysis that may be particularly useful to study large animals including humans where large organ size precludes manual quantitation of organ morphology.


Conflict of interest statement

Competing Interests: The authors have declared that no competing interests exist.

Figures

Figure 1
Figure 1. Large-scale capture and computer-assisted semi-automated analysis of the whole tissue section.
A: Virtual slice view of a human pancreatic section (ND11) immunostained for insulin (green), glucagon (red), somatostatin (white) and nuclei (blue). A series of contiguous images of a specimen is collected (illustrated as boxed panels) and merged into a single image montage (i.e. virtual slice; arrowed). A composite is made by merging four overlapping virtual slice images. B: Views of each channel showing cellular composition. a. beta-cells, b. alpha-cells, c. delta-cells, and d. composite of all three endocrine cells. Note that there is no overlap among the endocrine cell fractions. Corresponding converted 8-bit masks after automatic thresholidng are shown in e. A contour shown in e (a red line) is used to measure islet area, which includes non-labeled area (e.g. capillaries). Based on the captured center coordinates of each cell type within the given islet, its architecture is reconstructed in f.
Figure 2
Figure 2. Representative pancreas images.
A: Pancreatic sections immunostained for insulin (green), glucagon (red), somatostatin (white) and nuclei (blue) of relatively young and healthy subjects. ND1: 15-yr, ND3: 24-yr, and ND4: 41-yr. B: Non-diabetic and aged subjects. ND11: 63-yr, ND13: 73-yr, and ND15: 81-yr. C: Subjects with T2D. D2: 42-yr, D9: 72-yr, and D11: 75-yr.
Figure 3
Figure 3. Morphology of randomly selected islets.
ND4, ND7, ND10, ND12: specimen from non-diabetic subjects. D4, D8-D10: specimens from subjects with T2D. All listed by the ascending order of age in each group.
Figure 4
Figure 4. Endocrine cell mass and characteristics of islet architecture.
A: Inter-subject comparison. Total islet cell composition (beta-cells in green, alpha-cells in red, and delta-cells in blue) in individual non-diabetic subjects (a) and T2D patients (b). B: Morphological changes observed in large islets. Representative islets are pseudo-colored models of actual islets based on immunohistochemical images composed of beta-cells (green), alpha-cells (red), and delta-cells (white). From left to right: compacted endocrine cell arrangement, relatively sparse architecture, the presence of a population of cells lacking cytosolic hormones (blue), and cyst formation containing necrotic materials (purple). Corresponding small islets from the same sections in a to d are shown in e to h.
Figure 5
Figure 5. Individual islet size distribution and cellular compositions.
A: In non-diabetic subjects (ND1–ND14), relative frequency of islet size (gray bar) and ratios of alpha (red), beta (green), and delta (blue) cells within islets were plotted against islet size; means ± SEM. B: Results in T2D patients (D1–D12). Note that islet size is presented as a logarithmic scale considering the high number of small islets and the low number of large islets. In addition, we divided islet areas by the single-cell area, 170 µm2 , to make them as dimensionless values representing the number of cells in a given islet area. The conversion between logarithmic islet area (logarithmic) and effective diameter (µm) is shown.
Figure 6
Figure 6. Changes of islet size and cellular compositions in T2D.
A: Mean relative frequencies of islet sizes and cellular compositions (B: alpha-cell fraction, C: beta-cell fraction, and D: delta-cell fraction) depending on islet size in non-diabetic (gray; 8903 islets with n = 14) and T2D (color; 7929 islets with n = 12) subjects (mean ± SEM). The numbers in parentheses represent effective islet diameters (µm) corresponding to the given logarithmic dimensionless islet areas. Student's t-test compared the results between non-diabetic and T2D subjects at each size bin with *P<0.05, **P<0.001, and ***P<0.0001.
Figure 7
Figure 7. Changes of islet architecture in T2D.
A: A simple example to calculate cellular compositions and probabilities of contact between cell types in an islet consisting of 3 alpha- (red) and 4 beta- (green) cells. Lines represent contacts between neighboring cells. B: two examples of distinctive architectures: random mixture of cells (left) and a regular structure (right) where cellular composition is the same (alpha:beta = 3∶7). The numbers in parentheses are the probabilities of contact between cell types in the random cell mixture, which are theoretically estimated as (Pαα  =  ×, Pββ  =  ×, Pαβ  =  × + ×). C: Probabilities of alpha-alpha, beta-beta, and alpha-beta cell contacts in non-diabetic subjects (blue; 6886 islets with n = 14). Those were compared with the theoretical estimation for random mixtures of cells (gray) where cellular compositions were the same with the individual islets in non-diabetic subjects (mean ± SEM). D: Comparison between non-diabetic (blue) and T2D (red; 5359 islets with n = 12) subjects. Note that scattered single endocrine cells are excluded in the calculation because contacting cells does not exist for them. The numbers in parentheses represent effective islet diameters (µm) corresponding to the given logarithmic dimensionless islet areas. Student's t-test compared the results between non-diabetic and T2D subjects at each size bin with *P<0.05, **P<0.001, and ***P<0.0001.
Figure 8
Figure 8. Cellular arrangement of delta-cells.
A: Probabilities of delta-delta, delta-beta, and delta-alpha cell contacts in non-diabetic subjects (blue; 6886 islets with n = 14). Those were compared with the theoretical estimation for random mixtures of cells (gray) where cellular compositions were the same with the individual islets in non-diabetic subjects (mean ± SEM). B: Comparison between non-diabetic (blue) and T2D (red; 5359 islets with n = 12) subjects. Note that scattered single endocrine cells are excluded in the calculation because contacting cells does not exist for them. The numbers in parentheses represent effective islet diameters (µm) corresponding to the given logarithmic dimensionless islet areas. Student's t-test compared the results between non-diabetic and T2D subjects at each size bin with *P<0.05, **P<0.001, and ***P<0.0001.

References

    1. Levetan CS, Passaro M, Jablonski K, Kass M, Ratner RE. Unrecognized diabetes among hospitalized patients. Diabetes Care. 1998;21:246–249. - PubMed
    1. Harris MI, Eastman RC. Early detection of undiagnosed diabetes mellitus: a US perspective. Diabetes Metab Res Rev. 2000;1:230–236. - PubMed
    1. Matveyenko AV, Butler PC. Relationship between beta-cell mass and diabetes onset. Diabetes Obes Metab. 2008;10(Suppl):23–31. - PMC - PubMed
    1. Marchetti P, Lupi R, Del Guerra S, Bugliani M, Marselli L, et al. The beta-cell in human type 2 diabetes. Adv Exp Med Biol. 2010;654:501–514. - PubMed
    1. Marchetti P, Dotta F, Lauro D, Purrello F. An overview of pancreatic beta-cell defects in human type 2 diabetes: implications for treatment. Regul Pept. 2008;146:4–11. - PubMed

Publication types