. 2011;6(11):e27544.
doi: 10.1371/journal.pone.0027544. Epub 2011 Nov 15.

PLD$ is involved in phagocytosis of microglia: expression and localization changes of PLD4 are correlated with activation state of microglia

Affiliations

PLD$ is involved in phagocytosis of microglia: expression and localization changes of PLD4 are correlated with activation state of microglia

Yoshinori Otani et al. PLoS One. 2011.

Abstract

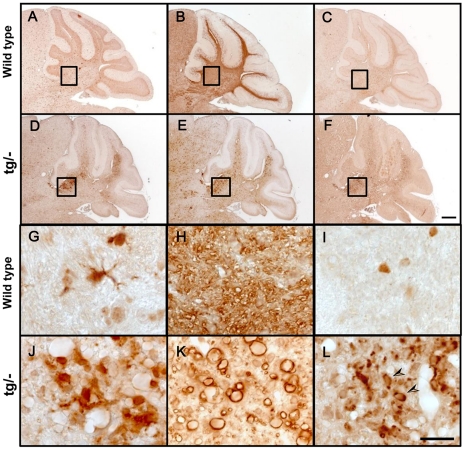
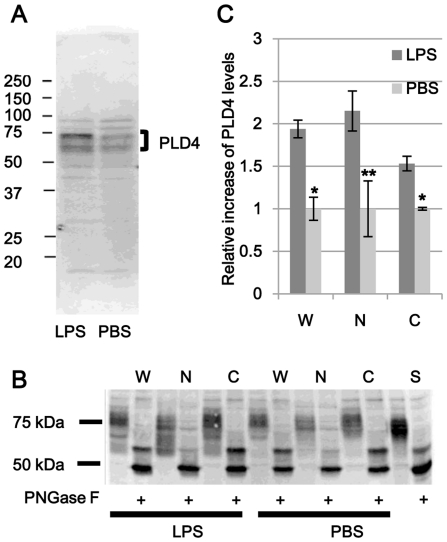
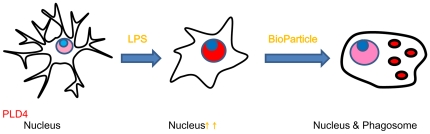
Phospholipase D4 (PLD4) is a recently identified protein that is mainly expressed in the ionized calcium binding adapter molecule 1 (Iba1)-positive microglia in the early postnatal mouse cerebellar white matter. Unlike PLD1 and PLD2, PLD4 exhibits no enzymatic activity for conversion of phosphatidylcholine into choline and phosphatidic acid, and its function is completely unknown. In the present study, we examined the distribution of PLD4 in mouse cerebellar white matter during development and under pathological conditions. Immunohistochemical analysis revealed that PLD4 expression was associated with microglial activation under such two different circumstances. A primary cultured microglia and microglial cell line (MG6) showed that PLD4 was mainly present in the nucleus, except the nucleolus, and expression of PLD4 was upregulated by lipopolysaccharide (LPS) stimulation. In the analysis of phagocytosis of LPS-stimulated microglia, PLD4 was co-localized with phagosomes that contained BioParticles. Inhibition of PLD4 expression using PLD4 specific small interfering RNA (siRNA) in MG6 cells significantly reduced the ratio of phagocytotic cell numbers. These results suggest that the increased PLD4 in the activation process is involved in phagocytosis of activated microglia in the developmental stages and pathological conditions of white matter.


Conflict of interest statement

Competing Interests: The authors have no financial relationships and no conflicts of interest relevant to this article.

Figures

Figure 1
Figure 1. Localization of PLD4-mRNA-expressing cells in developing mouse cerebellum.
Distribution of PLD4-mRNA-positive cells was examined by in situ hybridization in developing mouse cerebellum. PLD4-positive signals started to appear in the cerebellum at P0 (A). PLD4-positive cells increased in the proximal cerebellar white matter at P3 (B), and were distributed widely in the distal cerebellar white matter at P5 (C) and P7 (D). Signals started to be dispersed to the gray matter at P10 (Fig. 1E) and were rarely found at P21 (Fig. 1F). The morphology of cerebellar white matter during development is illustrated (G). The red dotted squares indicate the approximate fields of view. Scale bar, 100 µm. PLD4-positive cell numbers per area were obtained from six individual sections of mice at each age (H). The data were presented as mean ± SE of six experiments.
Figure 2
Figure 2. Expression of Iba1, MBP and PLD4 in the cerebella of PLPtg/− and wild type mice.
Sections prepared from 4.5-month-old PLPtg/− (D–F) and wild type (A–C) mouse cerebella were immunostained with antibodies against Iba1 (A, D), MBP (B, E), and PLD4 (C, F). In wild type, weak signals of Iba1 (A) and PLD4 (B) were found in white matter. In contrast, the Iba1-positive (D) and PLD4-positive (F) strong signals were observed in the proximal cerebellar white matter of PLPtg/− mice, where abnormal MBP-positive signals indicated demyelinated lesions (E). The enlarged images of the squares in A–F are shown in G–L, respectively. The results indicate that PLD4 is upregulated in activated microglia in demyelinating conditions in cerebellar white matter. Arrowheads in L show strong PLD4 signals in the cytoplasm. Scale bars; 100 µm in F for A–F and 20 µm in L for G–L.
Figure 3
Figure 3. Nuclear localization of PLD4 in primary microglia and MG6 cells.
Primary microglial cells (A, B) and MG6 cells (C, D) were treated with LPS (500 ng/ml) (B, D) or vehicle (A, C). (A and B) Primary cultured microglia were identified by CD11b-positive signals (red). The nuclei were weakly positive for PLD4 in vehicle-treated microglia (A), whereas strong PLD4 signals were found in the nuclei of LPS-stimulated microglia (B). (C and D) In MG6 cells, PLD4-positive signals (green) were detected in the nucleus, except the nucleoli (C). The signal intensities of PLD4 in the nuclei were markedly increased in LPS-stimulated MG6 cells (D). The Z-stack image of the nucleus was obtained using confocal microscopy. PLD4-positive signals (green) were detected in the internal part of the nucleus (blue) in MG6 cells (D). Blue signals indicated DAPI-stained nuclei. Scale bars, 20 µm. Intensity of nuclear PLD4 signals in LPS-treated primary microglia (E) and MG6 cells (F) was calculated against that of vehicle-treated controls. The data were presented as mean ± SE of four experiments. Asterisks in E and F indicate P<0.01 (Mann-Whitney's U test).
Figure 4
Figure 4. Localization of PLD4 in phagosomes of primary microglia and MG6 cells during phagocytosis.
Primary cultured microglia (A, B) and MG6 cells (E, F) were treated with LPS (500 ng/ml) (B, F) or vehicle (A, E) and were incubated with BioParticles (red). The cells were immunostained with anti-PLD4 antibody (green). LPS treatment stimulated phagocytosis, and these cells contained more BioParticles (B, F). PLD4-positive signals were co-localized with BioParticles in phagosomes (yellow in A, B, E, F), whereas they were mainly found in the nuclei of the cells without BioParticles as shown in Fig. 3. LPS-stimulated primary cultured microglia (C, D) and MG6 cells (G, H) were incubated with BioParticles (green). The cells were double labeled with anti-PLD4 antibody (blue) and Alexa 594-transferrin or Lysotracker-DNRed99 (red). PLD4- and transferrin-positive signals were co-localized in BioParticle-containing phagosomes (white in C and G), whereas PLD4 and Lysotracker signals were co-localized only in a few phagosomes (D and H). Scale bar in F (for E and F), 20 µm. Scale bar in D (for A to D) and H (for G and H), 10 µm. Percentages of PLD4+/Lysotracker+ (Lysotracker) or PLD4+/Transferrin+ (transferrin) vesicles were compared in primary microglia (I) and in MG6 cells (J). The data were presented as mean ± SE of four experiments. Asterisks in I and J indicate P<0.01 (Mann-Whitney's U test).
Figure 5
Figure 5. Increase of PLD4 level by LPS stimulation in MG6 cells.
MG6 cells were treated with LPS (500 ng/ml) or vehicle (PBS) for 24 hrs. (A) The Western blot analysis (15 µg proteins, 10.5% SDS-PAGE) using anti-PLD4 antibody revealed that the levels of PLD4-related bands (70–80 kDa) were increased in LPS-stimulated MG6 cells (left) compared with those in control cells (right). (B) Whole cell homogenates (W), nuclear fractions (N), and supernatants (C) were prepared. Mouse spleen homogenate (S) was prepared as a positive control. Each sample was deglycosylated by peptide-N-glycosidase F (PNGase F). Western blot analysis (15 µg proteins, 10.5% SDS-PAGE) using PLD4 antibody revealed that PLD4-positive bands were found in the nuclear fraction and supernatants. After PNGase F treatment, PLD4-positive band sizes were changed (48 kDa). (C) Intensity of each band was measured and relative increase of PLD4 by LPS-stimulation in each fraction was expressed graphically. The data are presented as mean ± SE of four experiments. Asterisk and double asterisk in C indicate P<0.01 and P<0.05 by Mann-Whitney's U test, respectively. Levels of PLD4 were increased in all LPS-stimulated MG6 cell samples compared with those in control cell samples.
Figure 6
Figure 6. Influence of PLD4 knock down in MG6 cells by siRNA treatment.
(A) MG6 cells were transfected with PLD4-siRNA or control (cont)-siRNA (100 nM each) for 48 h. Total RNA was isolated from these cells and analyzed by RT-PCR for PLD4 (above) and GAPDH (below) mRNA expression. Expression of PLD4 mRNA was efficiently reduced by 100 nM PLD4 siRNA treatment. The immunofluorescence staining of PLD4 (green) revealed that PLD4 was downregulated in PLD4-siRNA-treated cells (left), compared with Cont-siRNA (right) by 100 nM siRNA treatment. Scale bars, 20 µm. (B) MG6 cells were transfected with siRNA for 24 h, and LPS (500 ng/ml) or PBS (vehicle) were added to the medium. After 24 h, secretion of TNF-α was measured by ELISA. Measurement of PLD4-siRNA-treated cells was used as a standard value. Secretion of TNF-α was not significant in the siRNA-treated groups (n = 4). (C) LPS-stimulated (dark gray bars) or vehicle-treated (gray bars) MG6 cells were treated with or without siRNA for 48 h. Measurement at 0 h before addition of LPS or PBS was used as a standard value. Proliferation was examined by cell counting kit (n = 4). (D) MG6 cells were transfected with PLD4- or control (cont)-siRNA for 48 h. Vehicle-treated cells were used as a control. Cells were incubated with BioParticles. BioParticle-containing cells were analyzed by FACS, and phagocytic activity was calculated by dividing these cell numbers by the total. The graph shows the percentage of phagocytic activity of each siRNA-treated cells compared with that of the control cells. The data are presented as mean ± SE of five experiments. Asterisks in C and double asterisk in D indicate P<0.01 and P<0.05 by Mann-Whitney's U test, respectively.
Figure 7
Figure 7. Localization change of PLD4 in cultured microglia.
PLD4 was located in the nucleus during the resting state. After LPS stimulation, expression of PLD4 was increased. In the phagocytotic state eating BioParticles, PLD4 accumulated in the early phagosomes.

Similar articles

Cited by

References

    1. Yoshikawa F, Banno Y, Otani Y, Yamaguchi Y, Nagakura-Takagi Y, et al. Phospholipase D family member 4, a transmembrane glycoprotein with no phospholipase D activity, expressed in spleen and early postnatal microglia. PLoS One. 2010;5:e13932. - PMC - PubMed
    1. Pedersen KM, Finsen B, Celis JE, Jensen NA. Expression of a novel murine phospholipase D homolog coincides with late neuronal development in the forebrain. J Biol Chem. 1998;273:31494–31504. - PubMed
    1. Choi SY, Huang P, Jenkins GM, Chan DC, Schiller J, et al. A common lipid links Mfn-mediated mitochondrial fusion and SNARE-regulated exocytosis. Nat Cell Biol. 2006;8:1255–1262. - PubMed
    1. Sung TC, Roper RL, Zhang Y, Rudge SA, Temel R, et al. Mutagenesis of phospholipase D defines a superfamily including a trans-Golgi viral protein required for poxvirus pathogenicity. EMBO. 1997;16:4519–4530. - PMC - PubMed
    1. Munck A, Bohm C, Seibel NM, Hashemol HZ, Hampe W. Hu-K4 is a ubiquitously expressed type 2 transmembrane protein associated with the endoplasmic reticulum. FEBS J. 2005;272:1718–1726. - PubMed

Publication types

MeSH terms