. 2011 Dec 1;12(11):957-65.
doi: 10.4161/cbt.12.11.18134. Epub 2011 Dec 1.

Rosiglitazone delayed weight loss and anorexia while attenuating adipose depletion in mice with cancer cachexia

Affiliations

Rosiglitazone delayed weight loss and anorexia while attenuating adipose depletion in mice with cancer cachexia

Michelle L Asp et al. Cancer Biol Ther. .

Abstract

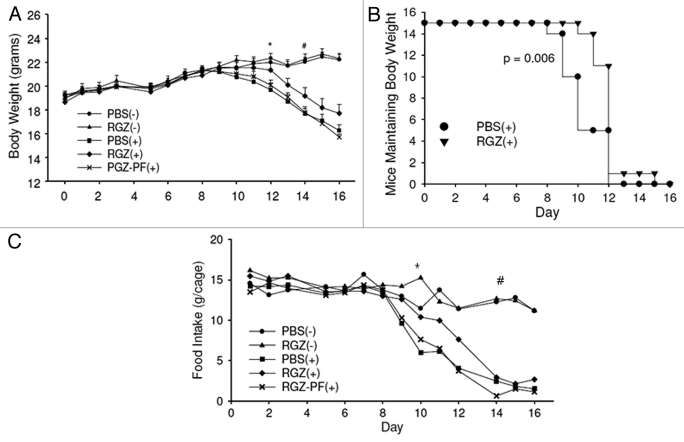
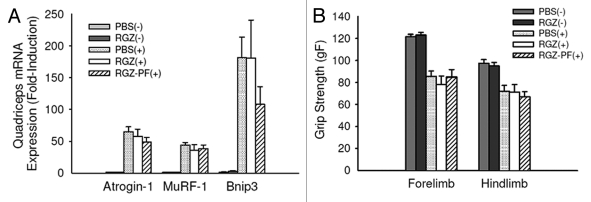
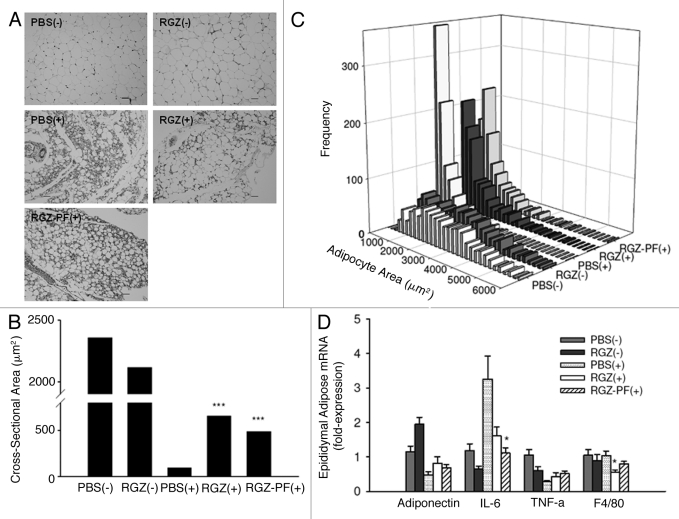
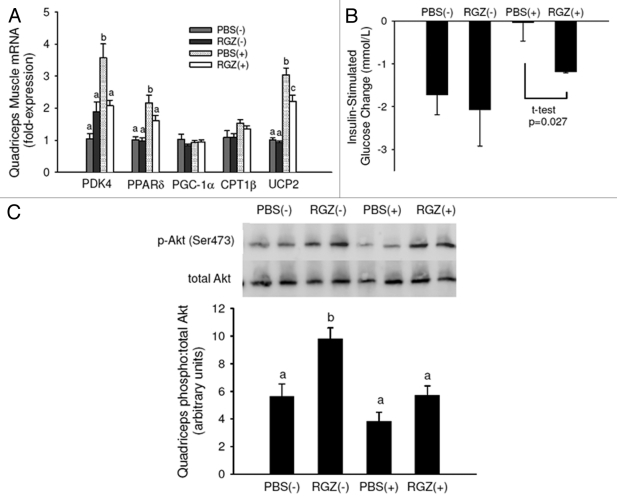
Cachexia is characterized by severe weight loss, including adipose and muscle wasting, and occurs in a large percentage of cancer patients. Insulin resistance contributes to dysregulated metabolism in cachexia and occurs prior to weight loss in mice with colon-26 tumor-induced cachexia. Therefore, we hypothesized that the insulin sensitizer, rosiglitazone, would attenuate the loss of adipose and muscle to result in improved outcomes for mice with late-stage cachexia. Male CD2F1 mice were inoculated with colon-26 adenocarcinoma cells or vehicle. Treatments included vehicle, rosiglitazone (10 mg/kg body weight/day) or rosiglitazone plus pair-feeding to food intake of vehicle-treated mice with tumors. Rosiglitazone delayed weight loss onset by 2 d over the 16 d duration of this aggressive tumor model. This finding was associated, in part, with increased food intake. In addition, adipose mass, adipocyte cross-sectional area and inflammation were improved with rosiglitazone. However, at the time of necropsy 16 d after tumor inoculation rosiglitazone had no effect on retention of muscle mass, strength or proteolysis in late-stage cachexia. We did not measure stamina or endurance in this study. In early-stage cachexia, rosiglitazone normalized PDK4 and PPAR-delta mRNA in quadriceps muscle and rescued the decrease in insulin-stimulated glucose disappearance in mice with tumors. Rosiglitazone may delay weight loss onset by decreasing tumor-induced markers of metabolic change in early-stage cachexia. These changes predict for modest improvement in adipose, but no improvement in muscle strength in late-stage cachexia.


Figures

Figure 1.
Figure 1.
Body weight and food intake. (A) Mice were inoculated with 1x10⁶ colon-26 adenocarcinoma cells (+) or vehicle (-) and treated daily with intraperitoneal injections of either RGZ or PBS. Some RGZ-treated mice with tumors were pair-fed (PF) to PBS-treated mice with tumors. Body weights were measured daily. Groups with tumors were compared with the PBS(-) group for statistical analyses. *First day that the PBS(+) and RGZ-PF(+) groups had decreased body weight compared with the PBS(-) group. #First day that the RGZ(+) group had decreased body weight compared with the PBS(-) group. Significance continued through the remainder of the study. n = 13–15 mice/group. (B) Kaplan-Meier survival plot illustrating the difference in weight loss incidence between PBS(+) and RGZ(+) groups. p value represents a comparison of the two groups using a Wilcoxon Signed Rank test. (C) Food intake was measured daily throughout the study. Values represent the average intake per cage, n = three cages per treatment group. *First day that the PBS(+) group had decreased food intake compared with the PBS(-) group. #First day that the RGZ(+) group had reduced food intake compared with the PBS(-) group.
Figure 2.
Figure 2.
Markers of muscle proteolysis and strength. (A) Quadriceps muscle mRNA expression of proteolytic genes in mice with (+) and without (-) tumors treated daily with RGZ or PBS. Some tumor-bearing mice treated with RGZ were pair-fed [RGZ-PF(+)] to the PBS(+) group. n = 5–8 mice per group. No differences between tumor groups were detected. (B) Forelimb and hindlimb grip strength (gF, grams of force) 15 d after inoculation with tumor or vehicle. Each test was done in triplicate and averaged for each mouse. n = 13–15 mice per group. No differences between tumor groups were detected.
Figure 3.
Figure 3.
Adipocyte size and inflammation. (A) Representative images of hematoxylin and eosin-stained epididymal adipose sections. Magnification = 200x; bar = 50 μm. (B) Cross-sectional area of adipocytes was analyzed using Image J software. Graph represents median of 900 cells per group (100 cells/mouse x 9 mice). ***p < 0.001 compared with the PBS(+) group. (C) Histograms illustrating differences in the distribution of adipocyte cross-sectional areas between groups. (D) Epididymal adipose relative mRNA expression of adipocytokines (adiponectin, IL-6, TNF-α), and a marker of macrophage infiltration (F4/80), n = 5–7 mice per group for adiponectin, TNF-α, and F4/80, n = 11–14 mice per group for IL-6, *p < 0.05 compared with the PBS(+) group.
Figure 4.
Figure 4.
Early-stage cachexia quadriceps muscle gene expression and insulin sensitivity. (A) Quadriceps muscle mRNA expression in mice with (+) and without (-) tumors and treated daily with RGZ or PBS. n = 4 for PBS(-) and RGZ(-), n = 12 for PBS(+) and RGZ(+). Different letters represent significant differences between groups for each gene (p < 0.05). (B) After an overnight fast, blood glucose was tested before and 15 min after insulin administration (IP injection, 0.75 U/kg body weight). The graph represents glucose change in 15 min. PBS(+) and RGZ(+) are significantly different using a Student’s t-test. n = 4–5 mice per group. (C) Mice were sacrificed after 15 min glucose test and quadriceps Akt activation measured with protein gel blot. Pictured is relative density of the ratio of phosporylated (Ser473) to total Akt with representative blots. n = 3–5 mice per group.
Figure 5.
Figure 5.
Early-stage cachexia epididymal adipose gene expression and Akt activation, and serum NEFA. (A) Epididymal adipose mRNA expression in mice with (+) and without (-) tumors and treated daily with RGZ or PBS. n = 4 for PBS(-) and RGZ(-), n = 12 for PBS(+) and RGZ(+). Different letters represent significant differences between groups for each gene (p < 0.05). (B) Fasting serum NEFA. n = 4 for PBS(-) and RGZ(-) and n = 9–11 for PBS(+) and RGZ(+). Tumor-bearing groups are significantly different using a Student’s t-test. (C) Mice were sacrificed 15 min after insulin administration (IP injection, 0.75 U/kg body weight) and epididymal Akt activation measured with protein gel blot. Pictured is relative density of the ratio of phosporylated (Ser473) to total Akt with representative blots. n = 3–5 mice per group.

References

    1. Muscaritoli M, Anker SD, Argilés J, Aversa Z, Bauer JM, Biolo G, et al. Consensus definition of sarcopenia, cachexia and pre-cachexia: joint document elaborated by Special Interest Groups (SIG) “cachexia-anorexia in chronic wasting diseases” and “nutrition in geriatrics”. Clin Nutr. 2010;29:154–9. doi: 10.1016/j.clnu.2009.12.004. - DOI - PubMed
    1. Argilés JM, Almendro V, Busquets S, Lopez-Soriano FJ. The pharmacological treatment of cachexia. Curr Drug Targets. 2004;5:265–77. doi: 10.2174/1389450043490505. - DOI - PubMed
    1. Dewys WD, Begg C, Lavin PT, Band PR, Bennett JM, Bertino JR, et al. Prognostic effect of weight loss prior to chemotherapy in cancer patients. Am J Med. 1980;69:491–7. doi: 10.1016/S0149-2918(05)80001-3. - DOI - PubMed
    1. Warren S. The immediate causes of death in cancer. Am J Med Sci. 1932;184:610–5. doi: 10.1097/00000441-193211000-00002. - DOI
    1. Inagaki J, Rodriguez V, Bodey GP. Causes of death in cancer patients. Cancer. 1974;33:568–73. doi: 10.1002/1097-0142(197402)33:2<568::AID-CNCR2820330236>3.0.CO;2-2. - DOI - PubMed

Publication types

MeSH terms