Comparative Study
. 2011 Dec;121(12):4921-30.
doi: 10.1172/JCI59777. Epub 2011 Nov 21.

Age-related increases in PGD(2) expression impair respiratory DC migration, resulting in diminished T cell responses upon respiratory virus infection in mice

Affiliations
Comparative Study

Age-related increases in PGD(2) expression impair respiratory DC migration, resulting in diminished T cell responses upon respiratory virus infection in mice

Jincun Zhao et al. J Clin Invest. 2011 Dec.

Abstract

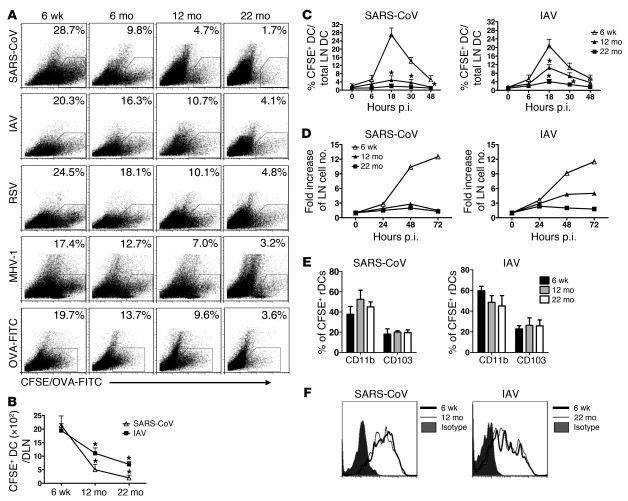
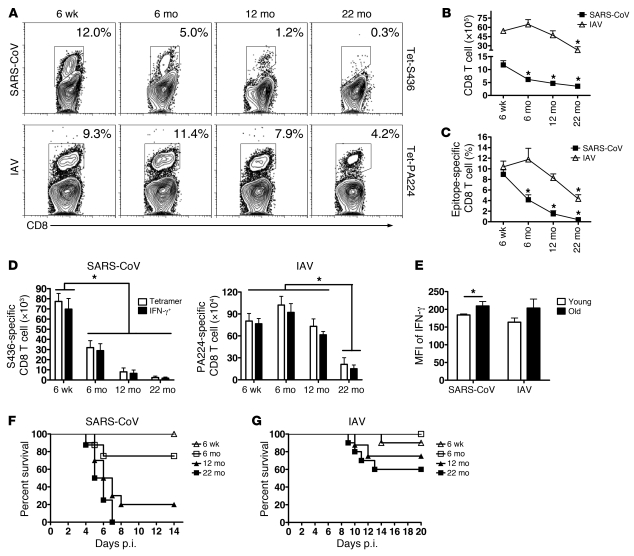
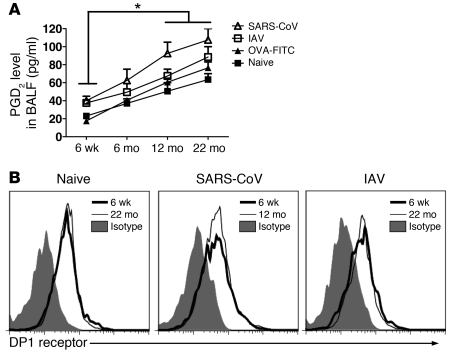
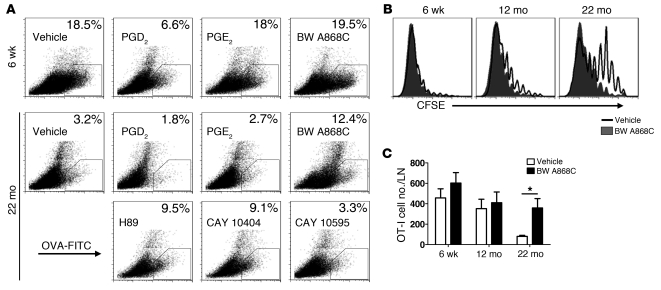
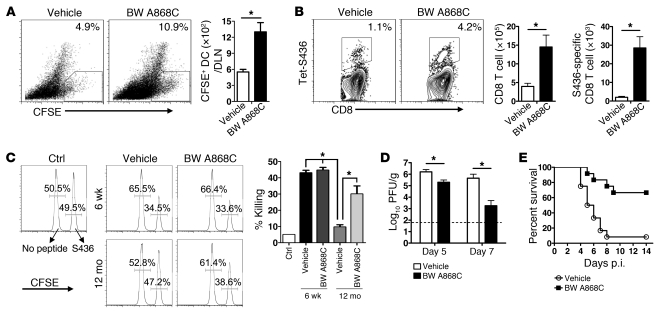
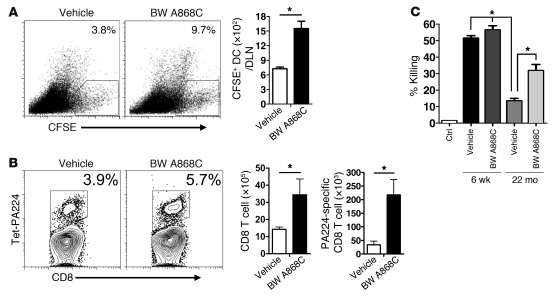
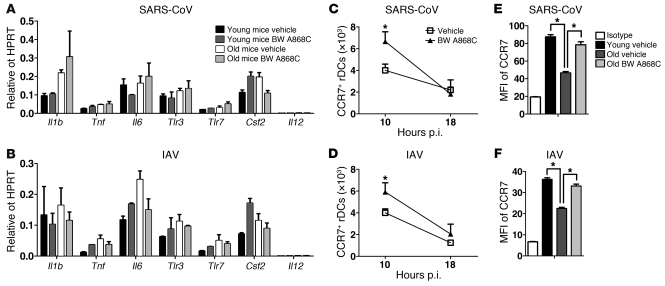
The morbidity and mortality associated with respiratory virus infection is felt most keenly among the elderly. T cells are necessary for viral clearance, and many age-dependent intrinsic T cell defects have been documented. However, the development of robust T cell responses in the lung also requires respiratory DCs (rDCs), which must process antigen and migrate to draining LNs (DLNs), and little is known about age-related defects in these T cell-extrinsic functions. Here, we show that increases in prostaglandin D(2) (PGD(2)) expression in mouse lungs upon aging correlate with a progressive impairment in rDC migration to DLNs. Decreased rDC migration resulted in diminished T cell responses and more severe clinical disease in older mice infected with respiratory viruses. Diminished rDC migration associated with virus-specific defects in T cell responses and was not a result of cell-intrinsic defect, rather it reflected the observed age-dependent increases in PGD(2) expression. Blocking PGD(2) function with small-molecule antagonists enhanced rDC migration, T cell responses, and survival. This effect correlated with upregulation on rDCs of CCR7, a chemokine receptor involved in DC chemotaxis. Our results suggest that inhibiting PGD(2) function may be a useful approach to enhance T cell responses against respiratory viruses in older humans.


Figures

Figure 1
Figure 1. rDC migration to DLNs progressively decreases in aged mice.
(A) Six-week-old, six-month-old, twelve-month-old, and twenty-two–month-old mice were i.n. inoculated with 50 μl 8 mM CFSE. Six hours after instillation, mice were infected with SARS-CoV, IAV, RSV, or MHV-1. Naive mice inoculated with 200 μg/75 μl OVA-FITC served as controls. After 18 hours, single-cell suspensions were prepared from lung DLNs. The numbers represent the percentage of CFSE+ cells within the CD11c+MHCII+ DC population per LN. (B) Total CFSE+ DC numbers per LN, (C) the time course of rDC migration to the DLNs, (D) fold increase in DLN cellularity relative to that of naive mice, and (E) the proportion of CD11b+ and CD103+ populations among CFSE+CD11c+MHCII+ rDCs in DLNs are also shown. (F) CD86 expression on rDCs in the lung 18 hours p.i. n = 4 mice in each group for each experiment. Data are representative of 5–10 independent experiments. *P <0.05 versus 6 week.
Figure 2
Figure 2. Age-dependent decreases in virus-specific CD8 T cell responses in lungs of SARS-CoV– and IAV-infected mice.
Lung cells were harvested from young and aged B6 mice 6 days or 8 days after SARS-CoV or IAV infection, respectively. (A) Tetramer staining for epitopes S436 (Tet-S436) and PA224 (Tet-PA224) (numbers represent the percentage of tetramer+ CD8 T cells), (B) total numbers of CD8 T cells, and (C) frequency and (D) numbers of tetramer+ or IFN-γ+ virus-specific CD8 T cells for epitopes S436 and PA224 are shown. *P < 0.05. (E) Geometric mean of fluorescence intensity (MFI) of IFN-γ production upon peptide stimulation is shown (young, 6 weeks old; old, 12 months old, SARS-CoV infected and 22 months old, IAV infected). n = 4–6 mice/group/experiment; *P < 0.05. Data are representative of 4–5 independent experiments. Mice of various ages were i.n. infected with (F) SARS-CoV or (G) IAV virus. Mortality was monitored daily. P values were determined by Kaplan-Meier survival tests (for SARS-CoV–infected mice, 6-week-old mice, n = 14; 6-month-old mice, n = 8; 12-month-old mice, n = 10; 22-month-old mice, n = 8; for 6-week-old versus 12-month-old or 22-month-old, P < 0.005) (for IAV-infected mice, 6-week-old mice, n = 10; 6-month-old mice, n = 8; 12-month-old mice, n = 8; 22-month-old mice, n = 10; for 6-week-old versus 22-month-old mice, P = 0.04).
Figure 3
Figure 3. Elevated levels of PGD2 in uninfected and infected aged mice.
(A) An enzyme immunoassay was used to quantify PGD2 levels in the BALF, following the manufacturer’s instructions. n = 4 mice in each age per experiment. Data are representative of 3 independent experiments. *P < 0.05. (B) DP1 receptor expression on rDCs harvested from the lungs of naive mice or mice at 18 hours after infection with SARS-CoV or IAV was measured, as described in Methods. Data are representative of 3 independent experiments.
Figure 4
Figure 4. Treatment with PGD2 antagonists enhances rDC migration and T cell proliferation in aged mice.
(A) Six-week-old or twenty-two–month-old mice were inoculated with 200 μg/75 μl OVA-FITC and PGD2, PGE2, BW A868C (DP1 receptor antagonist), H89 (PKA antagonist), CAY 10404 (COX-2 antagonist), or CAY 10595 (CRTH2 [DP2] receptor antagonist) i.n., as indicated in the figure. After 18 hours, single-cell suspensions were prepared from lung DLNs and analyzed for the presence of OVA-FITC+ rDCs. The numbers represent the percentage of OVA-FITC+ cells within the CD11c+MHCII+ DC population per LN. (B and C) Naive Thy1.1/Thy1.2 OT-I Tg CD8+ T cells were purified from the spleens of naive mice and labeled with CFSE. (B) A total of 5 × 10⁵ or (C) 5 × 10² CFSE-labeled T cells were injected i.v. into Thy1.2 recipients. Ten μg OVA-FITC was administered i.n. 24 hours later. After 4 days, DLNs were harvested and analyzed for the presence of CFSE+Thy1.1/Thy1.2-positive cells. n = 3–4 mice for each age per experiment. Data are representative of 3 independent experiments. *P < 0.05.
Figure 5
Figure 5. Treatment with PGD2 antagonist BW A868C enhances rDC migration and T cell responses in SARS-CoV–infected mice.
(A) Twelve-month-old mice were inoculated i.n. with 50 μl 8 mM CFSE. Six hours after instillation, mice were infected with SARS-CoV together with BW A868C or vehicle. After 18 hours, single-cell suspensions were prepared from lung DLNs (numbers represent the percentage of CFSE+ cells within the CD11c+MHCII+ DC population). Total CFSE+ DC numbers per LN are also shown. n = 4 mice for each age per experiment. Data are representative of 5 independent experiments. *P < 0.05. (B) Lung cells were harvested from 12-month-old B6 mice 6 days after SARS-CoV infection. Kb/S436 tetramer staining and total numbers of CD8 T cells and of Kb/S436 tetramer+ CD8 T cells are shown. Numbers represent the percentages of tetramer+ CD8 T cells. n = 4–6 mice/group/experiment. Data are representative of 7 independent experiments. *P < 0.05. (C) In vivo cytotoxicity assays were performed on day 6 p.i., and the percentage of killing was calculated, as described in Methods (numbers represent the percentage of cells labeled with different concentrations of CFSE). n = 4–6 mice/group/experiment. Data are representative of 2 independent experiments. *P < 0.05. Twelve-month-old mice were i.n. infected with 1 × 10⁴ PFUs SARS-CoV virus with or without BW A868C. (D) Viral titers are expressed as PFU/g tissue. n = 4 mice/group/time point. Data are representative of 2 independent experiments. *P < 0.05. (E) Mortality was monitored daily. n = 12 mice in vehicle group; n =12 mice in BW A868C group. P = 0.0007, determined by a Kaplan-Meier survival test.
Figure 6
Figure 6. Treatment with PGD2 antagonist BW A868C enhances rDC migration and T cell responses in IAV-infected mice.
(A) Twenty-two–month-old mice were inoculated i.n. with 50 μl 8 mM CFSE. Six hours after instillation, mice were infected with IAV together with BW A868C or vehicle. After 18 hours, single-cell suspensions were prepared from lung DLNs. The values represent the percentages of CFSE+ cells within the CD11c+MHCII+ DC population. Total CFSE+ DC numbers per LN are also shown. n = 4 mice for each age per experiment. Data are representative of 4 independent experiments. *P < 0.05. (B) Lung cells were harvested from 22-month-old B6 mice 8 days after IAV infection. Db/PA224 tetramer staining and total numbers of CD8 T cells and of Db/PA224 tetramer+ CD8 T cells are shown. Numbers represent the percentages of tetramer+ CD8 T cells. n = 4–6 mice/group/experiment. Data are representative of 5 independent experiments. *P < 0.05. (C) In vivo cytotoxicity assays were performed on day 7 p.i., and the percentage of killing was calculated, as described in Methods. n = 4–6 mice/group/experiment. Data are representative of 2 independent experiments. *P < 0.05.
Figure 7
Figure 7. Cytokine and chemokine RNA and CCR7 levels in young and aged mice after SARS-CoV or IAV infection and BW A868C treatment.
(A and B) Cytokine and chemokine RNA levels in infected lungs. RNA was extracted from (A) SARS-CoV– or (B) IAV-infected lungs 18 hours p.i. and processed, as described in Methods. n = 4 mice/group/experiment. Data are representative of 2 independent experiments. (C and D) Numbers of CD11c+MHCII+ SiglecF rDCs expressing CCR7 in (C) SARS-CoV– and (D) IAV-infected lungs at 10 and 18 hours p.i. (E and F) CCR7 expression on migratory rDCs in DLNs. Young and aged mice were inoculated i.n. with 50 μl 8 mM CFSE. Six hours after instillation, mice were infected with (E) SARS-CoV (6 weeks old and 12 months old) or (F) IAV (6 weeks old and 22 months old), together with BW A868C. After 18 hours single-cell suspensions were prepared from lung DLNs. CCR7 expression levels on the CFSE+CD11c+MHCII+ DC population are shown. n = 4–6 mice/group. Data are representative of 5–6 independent experiments. *P < 0.05.

Comment in

  • Slowing down with age: lung DCs do it too.
    Braciale TJ, Kim TS. Braciale TJ, et al. J Clin Invest. 2011 Dec;121(12):4636-9. doi: 10.1172/JCI61367. Epub 2011 Nov 21. J Clin Invest. 2011. PMID: 22105176 Free PMC article.

Similar articles

Cited by

References

    1. Yager EJ, Ahmed M, Lanzer K, Randall TD, Woodland DL, Blackman MA. Age-associated decline in T cell repertoire diversity leads to holes in the repertoire and impaired immunity to influenza virus. J Exp Med. 2008;205(3):711–723. doi: 10.1084/jem.20071140. - DOI - PMC - PubMed
    1. Brien JD, Uhrlaub JL, Hirsch A, Wiley CA, Nikolich-Zugich J. Key role of T cell defects in age-related vulnerability to West Nile virus. J Exp Med. 2009;206(12):2735–2745. doi: 10.1084/jem.20090222. - DOI - PMC - PubMed
    1. Rockx B, et al. Early upregulation of acute respiratory distress syndrome-associated cytokines promotes lethal disease in an aged-mouse model of severe acute respiratory syndrome coronavirus infection. J Virol. 2009;83(14):7062–7074. doi: 10.1128/JVI.00127-09. - DOI - PMC - PubMed
    1. Nagata N, et al. Mouse-passaged severe acute respiratory syndrome-associated coronavirus leads to lethal pulmonary edema and diffuse alveolar damage in adult but not young mice. Am J Pathol. 2008;172(6):1625–1637. doi: 10.2353/ajpath.2008.071060. - DOI - PMC - PubMed
    1. Katz JM, Plowden J, Renshaw-Hoelscher M, Lu X, Tumpey TM, Sambhara S. Immunity to influenza: the challenges of protecting an aging population. Immunol Res. 2004;29(1–3):113–124. doi: 10.1385/IR:29:1-3:113. - DOI - PubMed

Publication types

MeSH terms