. 2011 Nov 28;195(5):903-20.
doi: 10.1083/jcb.201103045. Epub 2011 Nov 21.

Cortactin phosphorylation regulates cell invasion through a pH-dependent pathway

Affiliations

Cortactin phosphorylation regulates cell invasion through a pH-dependent pathway

Marco A O Magalhaes et al. J Cell Biol. .

Abstract

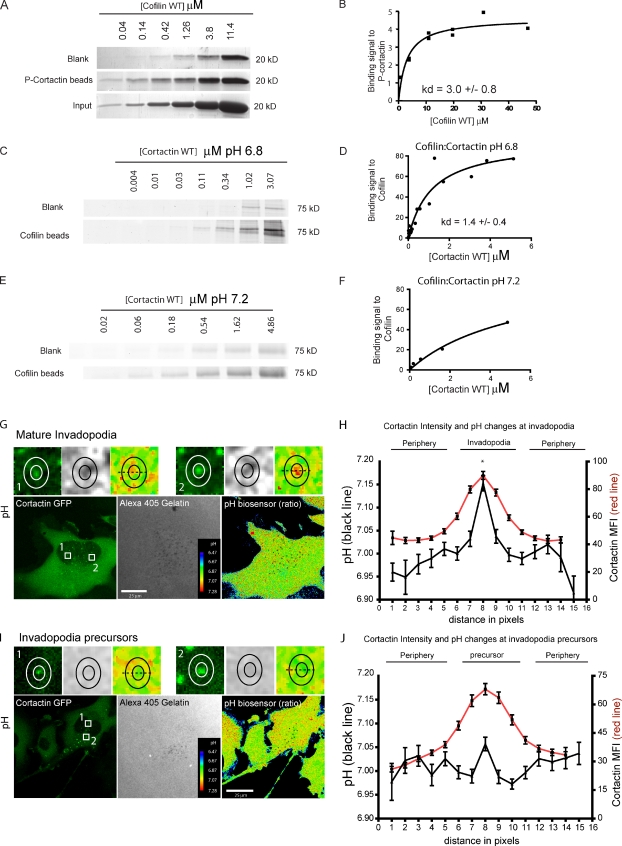
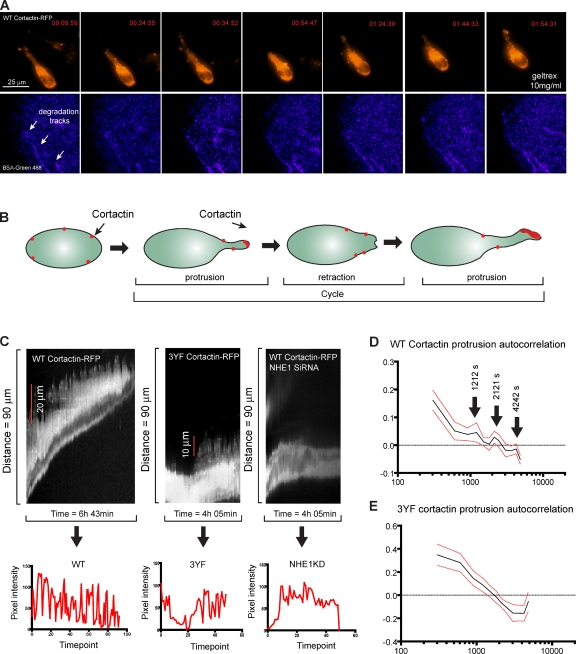
Invadopodia are invasive protrusions with proteolytic activity uniquely found in tumor cells. Cortactin phosphorylation is a key step during invadopodia maturation, regulating Nck1 binding and cofilin activity. The precise mechanism of cortactin-dependent cofilin regulation and the roles of this pathway in invadopodia maturation and cell invasion are not fully understood. We provide evidence that cortactin-cofilin binding is regulated by local pH changes at invadopodia that are mediated by the sodium-hydrogen exchanger NHE1. Furthermore, cortactin tyrosine phosphorylation mediates the recruitment of NHE1 to the invadopodium compartment, where it locally increases the pH to cause the release of cofilin from cortactin. We show that this mechanism involving cortactin phosphorylation, local pH increase, and cofilin activation regulates the dynamic cycles of invadopodium protrusion and retraction and is essential for cell invasion in 3D. Together, these findings identify a novel pH-dependent regulation of cell invasion.


Figures

Figure 1.
Figure 1.
Cortactin tyrosine phosphorylation and cofilin are required for invadopodia elongation. (A) Representative 3D reconstructions of the 1-µm Transwell experiment. Data are based on three or more independent experiments. (B) The number of protrusive structures crossing to the bottom of the membrane (>12 µm) normalized to the cell area on top of the membrane is shown (>10 fields per group, n = 4; ***, P < 0.0001). (C) Quantification of cell protrusion through a 1-µm Transwell without Matrigel. The GM 6001 inhibitor was used to show that cell protrusion was independent of degradation (>10 fields/group, n = 4; ***, P < 0.0001). Cortactin tyrosine phosphorylation regulates Cofilin interaction in invadopodia. (D) Representative cofilin–cortactin FRET efficiency images of cells expressing either WT or 3YF cortactin. The white circle indicates the bleached spot. The top right insets show close-ups of the original images (indicated by the boxed regions; n = 5). (E) Quantification of cofilin–cortactin FRET/donor at mature invadopodia and precursors in MDA-MB-231 cell lines expressing WT or 3YF cortactin (endogenous cortactin KD). Light gray bars represent FRET on mature invadopodia and dark gray bars represent FRET on invadopodia precursors (*, P < 0.002; n = 5, >30 invadopodia/group). Error bars indicate SEM.
Figure 2.
Figure 2.
Cortactin–cofilin binding in vitro is not dependent on cortactin phosphorylation, but is pH sensitive. (A and B) Coomassie-stained gels (A) and quantification of the binding signal of cofilin to phosphorylated cortactin (B; P-cortactin; Kd = 3.0 ± 0.8 µM); data points to Kd calculation = 16. (C and D) Coomassie-stained gels (C) and quantification of the binding signal of cortactin to cofilin at pH 6.8 (D). Kd = 1.4 ± 0.4 µM; data points to Kd calculation = 22. (E and F) Coomassie-stained gels (E) and quantification of the binding signal of cortactin to cofilin at pH 7.2 (F). Kd > 4.1 ± 1.3 µM; data points =14. Invadopodia pH increases during maturation. MDA-MB-231 cells were plated on a 405-gelatin matrix for 4 h and pH changes were analyzed using the SNARF 5F pH biosensor. (G and H) Representative images of pH changes in mature invadopodia (G) and the line profile quantification of the pH changes (H). The inner ring represents the invadopodia core and the outer ring depicts the invadopodia periphery. Top panels in G show the local pH changes in detail. (I and J) Representative images of pH changes in invadopodia precursors (I) and the line profile quantification of the pH changes (J). The solid black line represents the pH fluctuations colocalizing with the cortactin accumulation (red line). n = 97 invadopodia and 106 precursors, three independent experiments, P < 0.001 between point 8 and all other points (Bonferroni test).
Figure 3.
Figure 3.
Actin barbed-end formation at the invadopodia is regulated by pH. (A) Representative images of a barbed-end assay in WT cortactin cells in different pH conditions. A preserved barbed end increase in response to EGF was observed in these conditions. Insets show enlarged views of the boxed regions. (B) Quantification of barbed ends in response to EGF. Results are normalized to the Starved control barbed intensity (>150 invadopodia/group, n = 3; ***, P < 0.0001). (C) Quantification of barbed ends in response to EGF in NHE1KD cells. Results are normalized to the Starved control barbed intensity (> 180 invadopodia/group, n = 3; ***, P < 0.0001). Error bars indicate SEM.
Figure 4.
Figure 4.
Cortactin phosphorylation regulates NHE1 recruitment to the invadopodia. (A) Representative images of endogenous NHE1 and cortactin colocalization. (B) Representative image of MDA-MB-231 cells transiently expressing the WT NHE1-HA and WT cortactin. (C and D) The colocalization experiments were repeated in cells expressing KRA-NHE1–WT cortactin (C) and WT NHE1–3YF cortactin (D). Insets show enlarged views of the boxed regions. (E) Quantification of the cortactin–NHE1 colocalization. Results are based on the analysis of 15 cells/group; *, P < 0.01. (F) Quantification of NHE1-positive invadopodia precursors and mature invadopodia. The fraction of cortactin–NHE1–degradation colocalization was calculated in cells expressing WT NHE1-HA and WT cortactin. *, P < 0.05; **, P < 0.01. (G) Cells expressing WT cortactin or 3YF cortactin were lysed followed by coimmunoprecipitation of cortactin and NHE1. Although the NHE1 antibodies recognized cross-reacting bands, we used specific NHE1 siRNA to determine that the major identified bands were NHE1 (Fig. S2, D and E). (H) Quantification of NHE1 and cortactin coimmunoprecipitation. Results are based on three independent experiments. *, P < 0.03. (I) Quantification of cofilin–cortactin AP FRET at mature invadopodia and invadopodium precursors in MDA-MB-231 cells treated with NHE1 siRNA and rescued with either WT NHE1 or KRA NHE1. Mock cells are NHE1KD cells nucleoporated without a DNA construct (n = 2, >15 cells per group). Error bars indicate SEM. **, P < 0.01.
Figure 5.
Figure 5.
Invadopodia display a dynamic oscillatory behavior in 2D. (A) Representative images of MDA-MB-231 cells expressing WT cortactin-RFP and cofilin-GFP. The cells were imaged for 4 h and the fluctuation in the relative fluorescence intensity of cofilin and cortactin was analyzed and plotted. The insets show the boxed region. (B) Representative traces of WT cortactin and cofilin pixel intensity representative of 1 invadopodia from 12 analyzed. (C and D) The fluctuations in WT cortactin and cofilin fluorescence intensity were analyzed using autocorrelation (see Material and methods). The autocorrelation for WT cortactin is shown in C and the corresponding cofilin-GFP autocorrelation is shown in D. Data are based on the analysis of 12 invadopodia in three independent experiments. (E–G) The experiment was repeated in cells expressing 3YF cortactin-RFP and cofilin-GFP. (E) Representative traces of cofilin and 3YF cortactin pixel intensity (1/10). Autocorrelation analysis of the fluorescence intensity of 3YF cortactin is shown in F and the corresponding cofilin-GFP signal is shown in G. Red traces represent the standard error of the mean. (H) Representative images of cells expressing WT cortactin and the SNARF-5F pH indicator. Inner white circles represent the invadopodial core and the outer circles represent the invadopodium periphery. (I) Quantification of the coefficient of pH variation. n = 18 invadopodia in three experiments; ***, P < 0.001. Error bars indicate SEM.
Figure 6.
Figure 6.
Cofilin and cortactin phosphorylation are required for invadopodia protrusion. (A) Representative images of MDA-MB-231 cells expressing WT cortactin-RFP incubated in Geltrex + DQ Collagen IV (1:10) or Geltrex + BSA-Green 488 degradation marker. Images are representative of >50 cells analyzed in three independent experiments. (B) Representative images of WT cortactin cells embedded in the 3D matrix. The cells were imaged by confocal microscopy between 48 and 72 h after plating. The image is a 3D reconstruction of a representative field. Arrows and insets represent cells with invadopodia. The bottom right panel shows a representative TEM image of an invadopodium in a WT cortactin cell. (C) Representative images of 3YF cortactin cells embedded in the 3D matrix. The cells expressing 3YF cortactin-GFP were incubated as described (see Materials and methods). Arrows and bottom left insets represent high-magnification images of cells with invadopodia. The bottom right panel shows a representative TEM image of an invadopodium in a 3YF cortactin cell. Images are representative of 50 cells analyzed in three experiments. (D) Quantification of invadopodia length in 3D. Dominant protrusions enriched in cortactin were measured and the mean length analyzed. Approximately 20 cells per group were analyzed in four independent experiments. Where indicated, the cells were treated with specific SiRNA 24 h before seeding. The GM6001 inhibitor was used to show that the invadopodia protrusion is proteolysis dependent. (E) Quantification of cell protrusion through a 1-µm Transwell without Matrigel coating. Where indicated, cells were treated with NHE1 siRNA 72 h before the experiment and rescued with the described NHE1 constructs 24 h before the experiment (>8 fields/group, n = 3; **, P < 0.001). (F) Quantification of cell invasion through Matrigel-coated 1-µm Transwell. The number of protrusive structures crossing to the bottom of the membrane (>12 µm) was counted and normalized to the cell area on top of the membrane (>10 fields per group; **, P < 0.01).
Figure 7.
Figure 7.
Invadopodia are dynamic structures in 3D. (A) Representative images of MDA-MB-231 cells expressing WT cortactin-RFP incubated with Geltrex and BSA-Green 488 for 48 h. The cells were imaged for 8 h and the images represent snapshots of a time-lapse movie. The degradation marker channel was processed to highlight the degradation areas. (B) The cartoon shown represents the dynamics of invadopodia protrusion observed in these cells. Multiple cycles of invadopodia elongation and retraction are observed during cell invasion. Results are based on the analysis of 15 cells in three experiments. (C) Representative kymograph of a WT cortactin cell (left), a 3YF cortactin cell (middle), and a NHE1KD cell (right) migrating in 3D. The plots underneath represent the variations in pixel intensity of the protrusions over time. (D) Quantification of the WT cortactin protrusion autocorrelation. Cells expressing RFP-tagged WT cortactin were mixed with 10 mg/ml Geltrex and incubated for 24 h. Cells were imaged by between 24 and 48 h after plating. (E) Quantification of the 3YF cortactin protrusion autocorrelation. Cells expressing RFP-tagged 3YF cortactin were mixed with Geltrex and incubated for 24 h. Cells were imaged between 24 and 48 h after plating. n = 9 cells (WT) and 10 cells (3YF) in three independent experiments. Red traces represent the standard error of the mean.
Figure 8.
Figure 8.
A model for how cortactin phosphorylation regulates invadopodium maturation and tumor cell invasion through a pH-dependent pathway. Cortactin tyrosine phosphorylation regulates the interaction between NHE1 and cortactin. NHE1 alkalinizes the local invadopodia pH and induces the release of cortactin-bound cofilin. Released cofilin activates barbed end generation at the invadopodia and is deactivated by either phosphorylation or by rebinding cortactin after a decrease in local pH.

References

    1. Aharonovitz O., Zaun H.C., Balla T., York J.D., Orlowski J., Grinstein S. 2000. Intracellular pH regulation by Na(+)/H(+) exchange requires phosphatidylinositol 4,5-bisphosphate. J. Cell Biol. 150:213–224 10.1083/jcb.150.1.213 - DOI - PMC - PubMed
    1. Artym V.V., Zhang Y., Seillier-Moiseiwitsch F., Yamada K.M., Mueller S.C. 2006. Dynamic interactions of cortactin and membrane type 1 matrix metalloproteinase at invadopodia: defining the stages of invadopodia formation and function. Cancer Res. 66:3034–3043 10.1158/0008-5472.CAN-05-2177 - DOI - PubMed
    1. Artym V.V., Matsumoto K., Mueller S.C., Yamada K.M. 2011. Dynamic membrane remodeling at invadopodia differentiates invadopodia from podosomes. Eur. J. Cell Biol. 90:172–180 10.1016/j.ejcb.2010.06.006 - DOI - PMC - PubMed
    1. Ayala I., Baldassarre M., Giacchetti G., Caldieri G., Tetè S., Luini A., Buccione R. 2008. Multiple regulatory inputs converge on cortactin to control invadopodia biogenesis and extracellular matrix degradation. J. Cell Sci. 121:369–378 10.1242/jcs.008037 - DOI - PubMed
    1. Bailly M., Jones G.E. 2003. Polarised migration: cofilin holds the front. Curr. Biol. 13:R128–R130 10.1016/S0960-9822(03)00072-1 - DOI - PubMed

Publication types

MeSH terms