. 2012 Feb;42(2):500-10.
doi: 10.1002/eji.201141889. Epub 2011 Dec 27.

Affinity maturation of antibodies requires integrity of the adult thymus

Affiliations

Affinity maturation of antibodies requires integrity of the adult thymus

Mouhammed AbuAttieh et al. Eur J Immunol. 2012 Feb.

Abstract

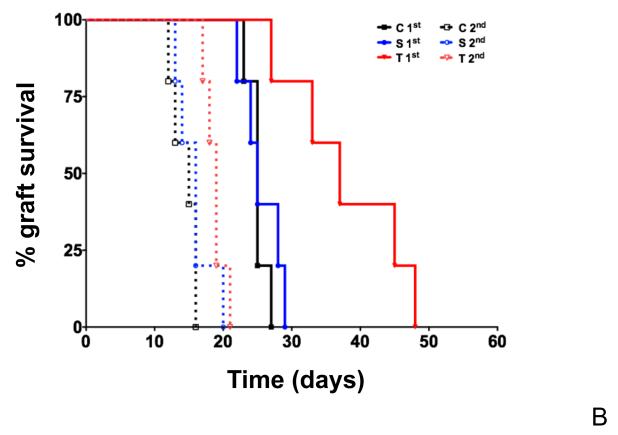
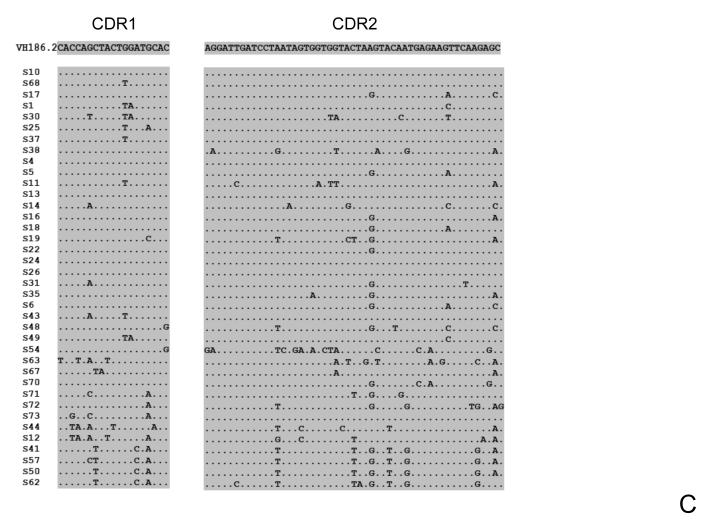
The generation of B-cell responses to proteins requires a functional thymus to produce CD4(+) T cells which helps in the activation and differentiation of B cells. Because the mature T-cell repertoire has abundant cells with the helper phenotype, one might predict that in mature individuals, the generation of B-cell memory would proceed independently of the thymus. Contrary to that prediction, we show here that the removal of the thymus after the establishment of the T-cell compartment or sham surgery without removal of the thymus impairs the affinity maturation of antibodies. Because removal or manipulation of the thymus did not decrease the frequency of mutation of the Ig variable heavy chain exons encoding antigen-specific antibodies, we conclude that the thymus controls affinity maturation of antibodies in the mature individual by facilitating the selection of B cells with high-affinity antibodies.


Figures

Figure 1
Figure 1. Number of lymphocytes in spleens harvested from mice lacking the thymus, sham-operated or non-manipulated controls at 5 and at 10 weeks of age
Thymectomies were performed 2 days before the mice turned 5 weeks old. Numbers of lymphocytes were calculated by multiplying the respective percentage as defined in a flow cytometry dot plot analysis, with specific monoclonal antibodies, by the total number of white blood cells (WBC) in athymic (T), sham-operated (S) or unmanipulated control (C) mice at 5 and 10 weeks (W) after surgery. (A) Number of CD4+ splenocytes or, (B) Number of CD8+ splenocytes. (C, D) Number of memory-like T cells in spleens defined as (CD4+or CD8+)/CD44hi/CD62L- by FACS analysis. In the graphs, the bar represents the average of each distribution. Means were compared by a paired two-tailed T test. Statistically significant differences are denoted by an asterisk and indicate P <0.05.
Figure 2
Figure 2. Primary cellular immune responses are delayed in mice lacking the thymus but T cell memory responses are maintained
(A) Delayed Type Hypersensitivity (DTH) responses to ovalbumin in control (C), sham-operated (S) or athymic (T) mice. DTH responses to intradermic injection of 20 μg ovalbumin were examined in the footpad of mice 6 days after priming by subcutaneous injection with 100 μg of ovalbumin (priming) or PBS (control). Footpad swelling measured in mm is indicated on the y-axis. Mice lacking the thymus produced significantly larger swelling (15 mm, on average) in response to challenge than sham-operated mice (6.0 mm, on average) or control mice (6.5 mm, on average). Footpad swelling was compared by a paired two-tailed T test. (B) Kaplan Meier survival curves for H-Y incompatible skin grafts in athymic (T), sham-operated (S) or control (C) mice. x-axis, days following surgery; y-axis, skin graft survival fraction. Grafts were considered rejected when 90% or more of the graft lacked any viable signs: hair, pigment and scale pattern. The median survival time of first set grafts was 25 days in control mice, 25 days in sham-operated mice and 37 days in mice lacking the thymus. Skin graft rejection by athymic mice was significantly delayed compared to rejection in controls (p=0.0052, log-rank, Mantel-Cox test). Secondary transplants were done 8 to 12 weeks after rejection of the first transplant. The median survival time of initial transplants was 15 days in control mice, 16 days in sham-operated mice and 19 days in athymic mice. Secondary graft survival in athymic recipients did not significantly differ from graft survival in control or sham-operated recipients.
Figure 3
Figure 3. T-independent antibody responses maintained in athymic mice
(A, B) T-independent antibody responses to NP-Ficoll in athymic mice (T) or in sham-operated (S) mice. Figures 3A and 3B represent the concentrations of NP-specific IgM (A) or NP-specific IgG3 (B), in μg/ml (y-axis) prior to and 21 days after immunization. Mice lacking the thymus and sham-operated mice had on average 4.0μg/ml and 5.0 μg/ml NP-specific IgM respectively, and non-detectable NP-specific IgG3, prior to immunization. Athymic and sham-operated mice had 230μg/ml and 167μg/ml NP-specific IgM, on average, 21 days after immunization, respectively. Mice lacking the thymus and sham-operated mice had on average 64μg/ml and 86 μg/ml NP-specific IgG3, 21 days after immunization, respectively. The concentrations of NP-specific IgM or IgG3 in athymic mice and in sham-operated mice did not significantly differ.
Figure 4
Figure 4. Removal of the thymus or sham operation maintained IgG1 specific antibody responses
(A, B) T-dependent responses to NP-ovalbumin. Figures 4A and 4B represent the concentrations of NP-specific IgM or NP-specific IgG1, in μg/ml (y-axis) prior to (PI) and the 21 days after primary (D21) or booster immunization (21PB), respectively. (A) Athymic mice (T) and sham-operated mice (S) had an average of 8.4μg/ml and 4.4μg/ml NP-specific IgM, prior to immunization (PI), 76 μg/ml and 111μg/ml, 21 days after immunization (D21), 293 μg/ml and 296 μg/ml 21 days after boosting (21PB), respectively. There were no significant differences between athymic and sham-operated mice. (B) Mice lacking the thymus or sham-operated mice had no detectable NP-specific IgG1 prior to immunization, but produced on average, 121μ μg/ml and 231μg/ml NP-specific IgG1 21 days after immunization, 596 μg/ml and 622 μg/ml 21 days after boosting, respectively. T test analysis revealed no significant differences between athymic and sham-operated mice.
Figure 5
Figure 5. Number of NP-specific IgG1 antibody secreting cells (ASC) in the bone marrow of mice lacking the thymus or control mice, 6 months after boost immunization
Mice lacking the thymus (T) had on average 198 ASC per 106 B cells while sham-operated mice (S) had an average of 113 ASC per 106 B cells and, control mice (C) had an average of 100 ASC per 106 B cells NP-specific IgG1 antibody secreting cells in the bone marrow. The number of ASC in athymic mice was significantly increased compared to the number of ASC in control (P=0.0042) or sham-operated mice (P=0.0075) (unpaired T test). The number of ASCs was calculated from 4 mice per group.
Figure 6
Figure 6. Heavy chain VH CDR1 and CDR 2 DNA sequences of IgG1-B cells obtained from the spleen of mice lacking the thymus (T), sham-operated (S) or control (C) mice, 10 days following boost immunization
Figures show the CDR1 or CDR2 sequences of all the distinct VH sequences aligned to the germline VH186.2 segments. Shadowed are CDR1 and CDR2 regions. (A) Sequences obtained from control non-manipulated mice; (B) Sequences obtained from athymic mice; (C) Sequences obtained from sham-operated mice.
Figure 7
Figure 7. Heavy chain VH aminoacid sequences of IgG1-B cells obtained from the spleen of mice lacking the thymus (A), sham-operated (B) or control (C) mice, 10 days following boost immunization
Figures show the aligned translation of all the distinct VH186.2 segments obtained from each group of mice. Shadowed are CDR1 and CDR2 regions and in a darker grey shade residue #33 is indicated. Antibodies with high affinity to NP often encode a W to L mutation in this position.

References

    1. Manz RA, Arce S, Cassese G, Hauser AE, Hiepe F, Radbruch A. Humoral immunity and long-lived plasma cells. Curr Opin Immunol. 2002;14:517–521. - PubMed
    1. Miller JF. Immunologic function of the thymus. Lancet. 1961;2:748–749. - PubMed
    1. Miller JF, De Burgh PM, Grant GA. Thymus and the production of antibody-plaque-forming cells. Nature. 1965;208:1332–1334. - PubMed
    1. Miller JF. Effect of thymectomy in adult mice on immunological responsiveness. Nature. 1965;208:1337–1338. - PubMed
    1. Metcalf D. Delayed effect of thymectomy in adult life on immunological competence. Nature. 1965;208:1336. - PubMed

Publication types

MeSH terms

Substances