

Inhibition of heat shock protein (molecular weight 90 kDa) attenuates proinflammatory cytokines and prevents lipopolysaccharide-induced liver injury in mice
- PMID: 22105779
- PMCID: PMC3342823
- DOI: 10.1002/hep.24802
Inhibition of heat shock protein (molecular weight 90 kDa) attenuates proinflammatory cytokines and prevents lipopolysaccharide-induced liver injury in mice
Abstract
Endotoxin-mediated proinflammatory cytokines play a significant role in the pathogenesis of acute and chronic liver diseases. Heat shock protein 90 (molecular weight, 90 kDa) (hsp90) functions as an important chaperone of lipopolysaccharide (LPS) signaling and is required for the production of proinflammatory cytokines. We hypothesized that inhibition of hsp90 would prevent LPS-induced liver injury by decreasing proinflammatory cytokines. C57BL/6 mice were injected intraperitoneally with an hsp90 inhibitor, 17-dimethylamino-ethylamino-17-demethoxygeldanamycin (17-DMAG), and LPS. Parameters of liver injury, proinflammatory cytokines, and associated mechanisms were studied by in vivo and in vitro experiments. Inhibition of hsp90 by 17-DMAG prevented LPS-induced increases in serum alanine aminotransferase activity and significantly reduced serum tumor necrosis factor alpha (TNFα) and interleukin-6 (IL-6) protein as well as messenger RNA (mRNA) in liver. Enhanced DNA-binding activity of heat shock transcription factor 1 (HSF1) and induction of target gene heat shock protein 70 (molecular weight, 70 kDa) confirmed hsp90 inhibition in liver. 17-DMAG treatment decreased cluster of differentiation 14 mRNA and LPS-induced nuclear factor kappa light-chain enhancer of activated B cells (NFκB) DNA binding without affecting Toll-like receptor 4 mRNA in liver. Mechanistic studies revealed that 17-DMAG-mediated inhibition of TNFα showed no effect on LPS-induced NFκB promoter-driven reporter activity, but significantly decreased TNFα promoter-driven reporter activity. Chromatin immunoprecipitation assays showed that 17-DMAG enhanced HSF1 binding to the TNFα promoter, but not the IL-6 promoter, suggesting HSF1 mediated direct inhibition of TNFα, but not IL-6. We show that HSF1 indirectly regulates IL-6 by the induction of another transcription factor, activating transcription factor 3. Inhibition of HSF1, using small interfering RNA, prevented 17-DMAG-mediated down-regulation of NFκB-binding activity, TNFα, and IL-6 induction, supporting a repressive role for HSF1 on proinflammatory cytokine genes during hsp90 inhibition.
Conclusion: Hsp90 inhibition in vivo reduces proinflammatory cytokines and prevents LPS-induced liver injury likely through repressive action of HSF1. Our results suggest a novel application for 17-DMAG in alleviating LPS-induced liver injury.
Copyright © 2011 American Association for the Study of Liver Diseases.
Figures
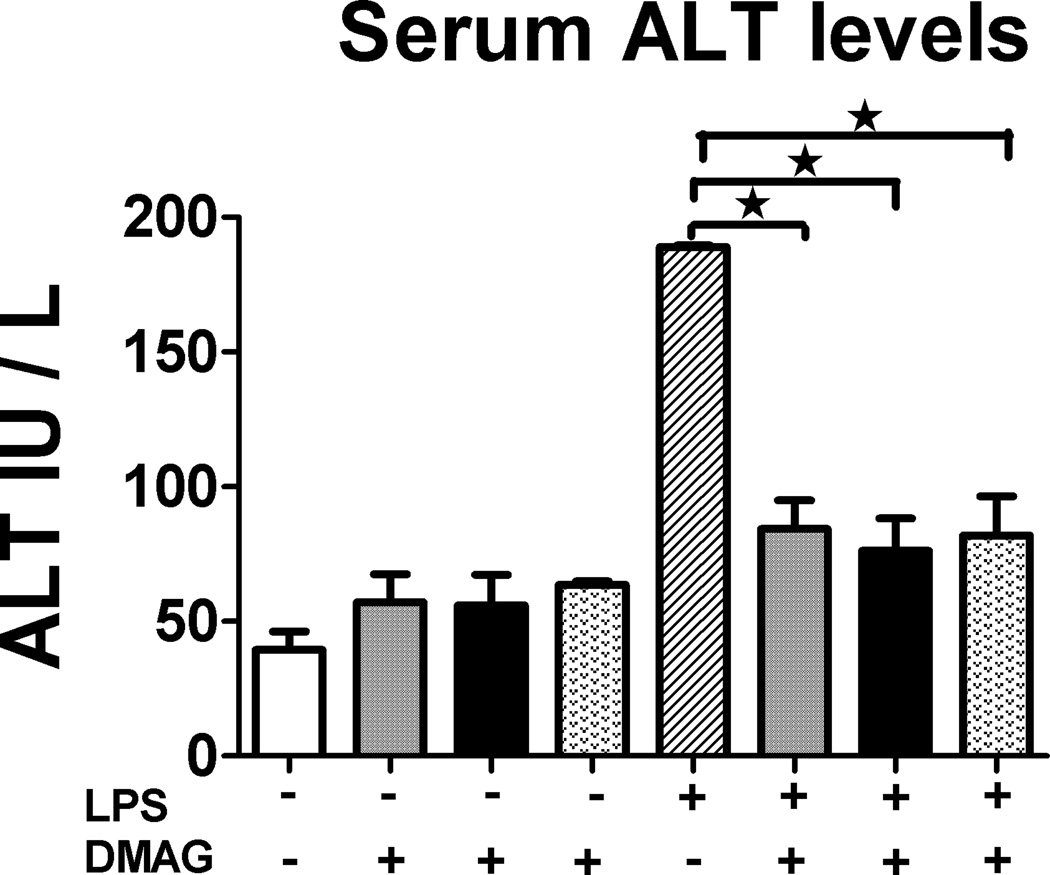
 0.5 mg/kg BW) and 17-DMAG (
 2.5,
2.5,  5 and
5 and  30 mg/kg BW) were injected intraperitoneally in C57BL/6 mice. All mice were sacrificed 18 hrs post injection and alanine aminotransferase [ALT] activity was determined in serum as described in supplementary information. Values are shown as mean ±SEM (5 mice per group). *p < 0.05 vs. LPS injected mice.
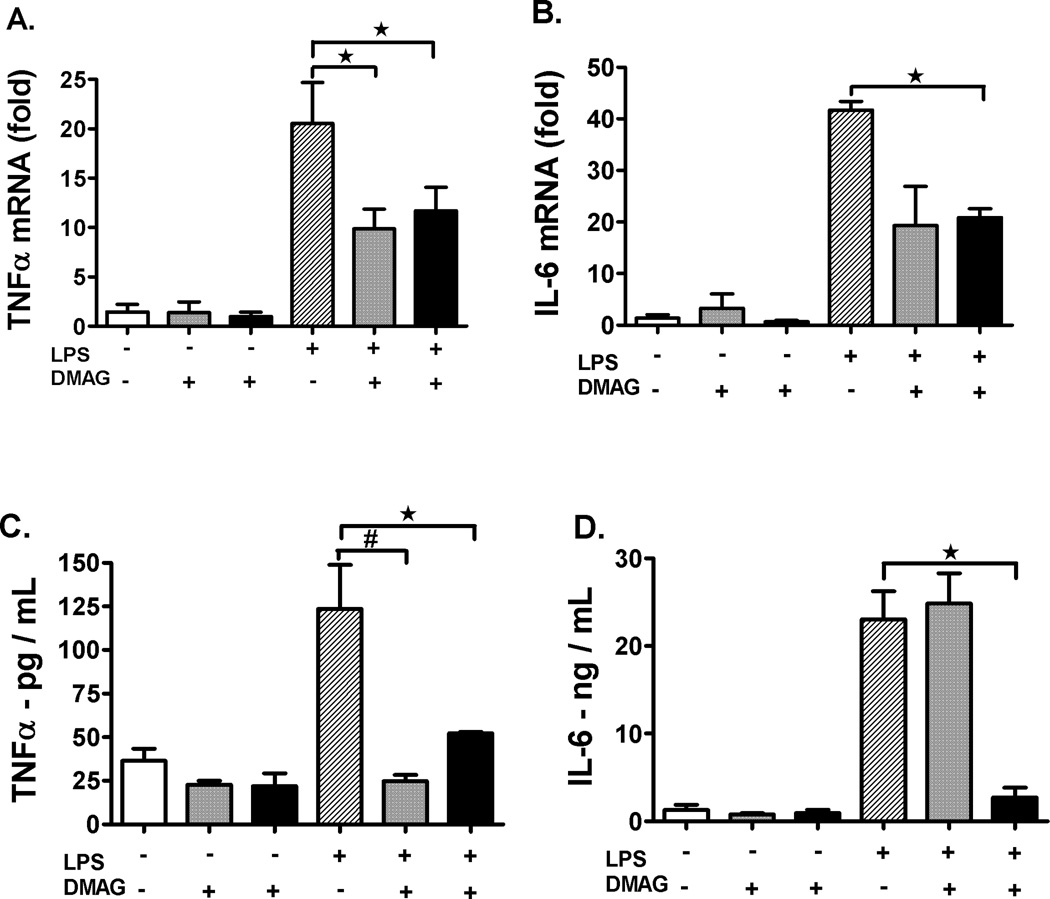 0.5 mg/kg BW) and 17-DMAG ( 2.5 and 5 mg/kg BW). All mice were sacrificed 2 hrs post injection and total RNA was extracted from liver. Messenger RNA levels of liver (A) TNFα, (B) IL-6, were analyzed by quantitative real-time PCR, and normalized to 18S rRNA. Results are expressed as mean fold change ± SEM over mice injected with saline (5 mice per group). Another set of C57BL/6 mice were injected intraperitoneally with LPS ( 0.5 mg/kg BW) and 17-DMAG ( 2.5 and 5 mg/kg BW) for 18 hrs and serum TNFα (C), IL-6 (D) was analyzed by ELISA. #p< 0.001, *p < 0.05 vs. LPS injected mice.
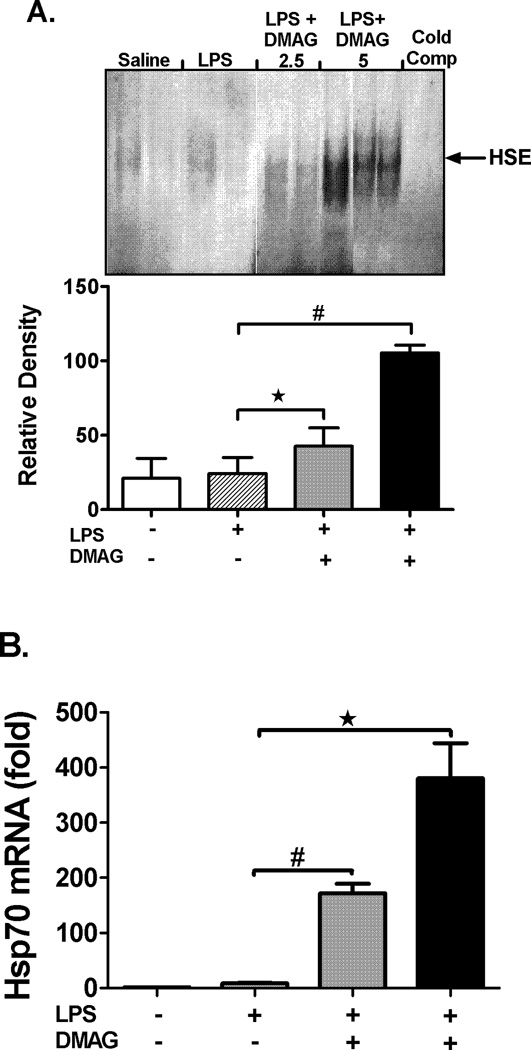 0.5 mg/kg BW) and 17-DMAG ( 2.5 and 5 mg/kg BW) and livers were collected at end of 2 hrs. DNA binding activity of HSF1 was detected in nuclear extracts of liver cells by EMSA using a 32P labeled, double stranded HSE oligonucleotide. (A) A representative EMSA picture is shown in upper panel and the bar graph in lower panel shows mean relative density ± SEM (5 mice per group). #p<0.01, *p < 0.05 compared to LPS injected mice. Hsp70 mRNA levels in the liver (B) were analyzed by quantitative real-time PCR and normalized to 18S rRNA. Results are expressed as mean fold change ± SEM over mice injected with saline (5 mice per group). #p<0.001, *p < 0.0001 vs. LPS injected mice. Hsp70 (C) and hsp90 (D) protein was detected in liver whole cell lysates by western blotting. β Tubulin is shown as internal loading control. A representative gel picture is shown with mean relative density ± SEM (3 mice per group). *p < 0.001 compared to LPS injected mice; ns-not significant.
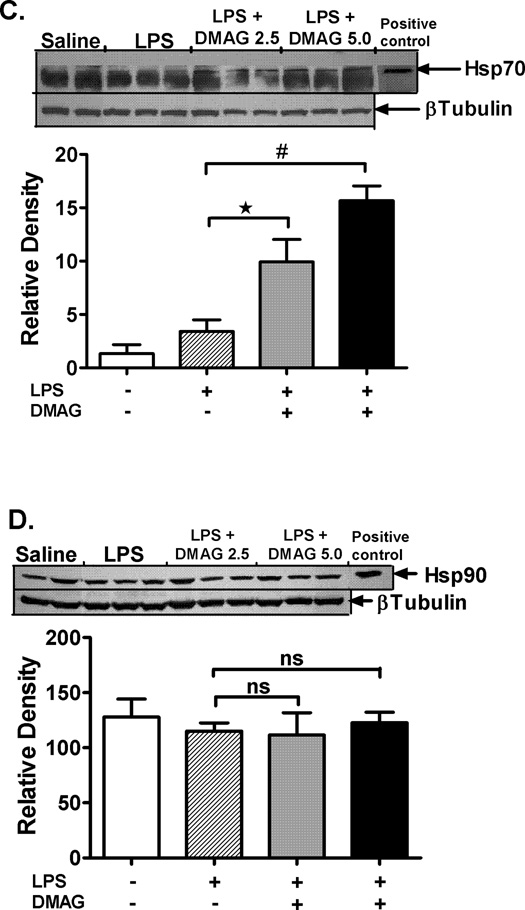 0.5 mg/kg BW) and 17-DMAG ( 2.5 and 5 mg/kg BW) and livers were collected at end of 2 hrs. DNA binding activity of HSF1 was detected in nuclear extracts of liver cells by EMSA using a 32P labeled, double stranded HSE oligonucleotide. (A) A representative EMSA picture is shown in upper panel and the bar graph in lower panel shows mean relative density ± SEM (5 mice per group). #p<0.01, *p < 0.05 compared to LPS injected mice. Hsp70 mRNA levels in the liver (B) were analyzed by quantitative real-time PCR and normalized to 18S rRNA. Results are expressed as mean fold change ± SEM over mice injected with saline (5 mice per group). #p<0.001, *p < 0.0001 vs. LPS injected mice. Hsp70 (C) and hsp90 (D) protein was detected in liver whole cell lysates by western blotting. β Tubulin is shown as internal loading control. A representative gel picture is shown with mean relative density ± SEM (3 mice per group). *p < 0.001 compared to LPS injected mice; ns-not significant.
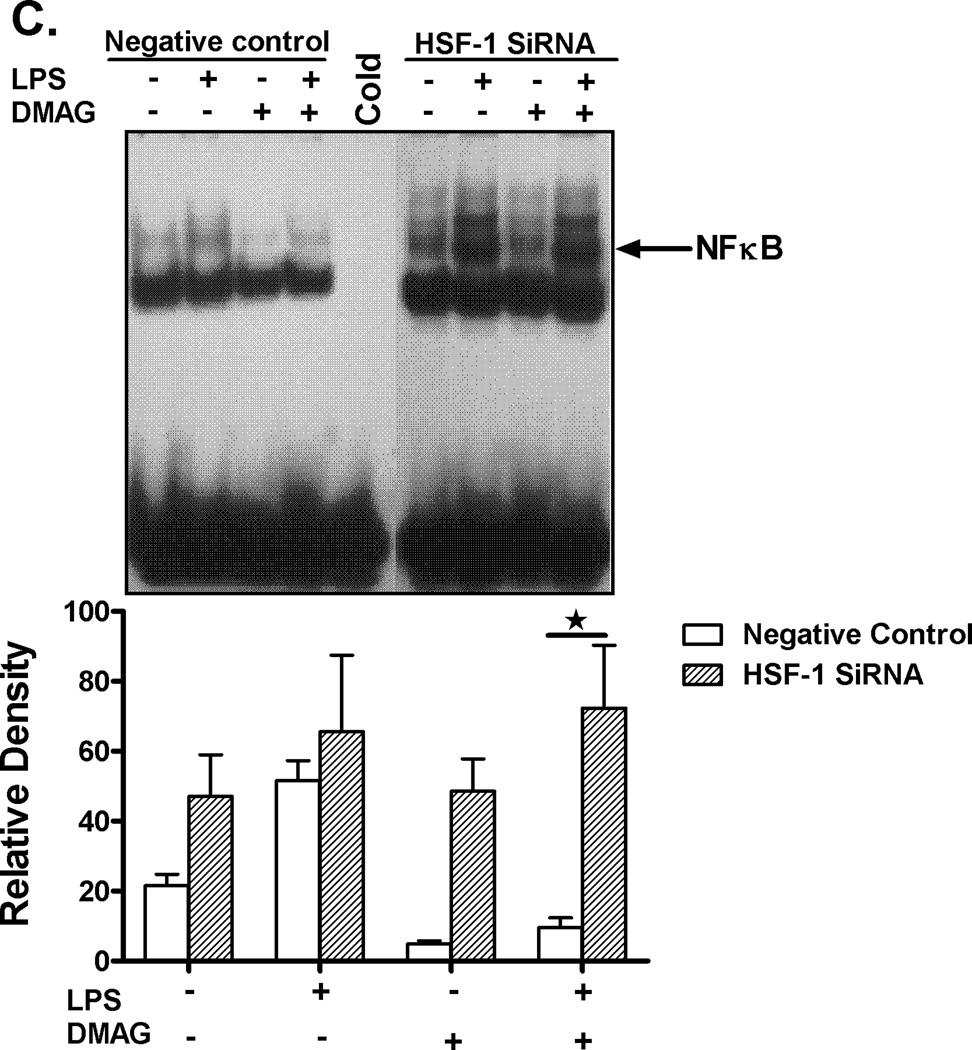
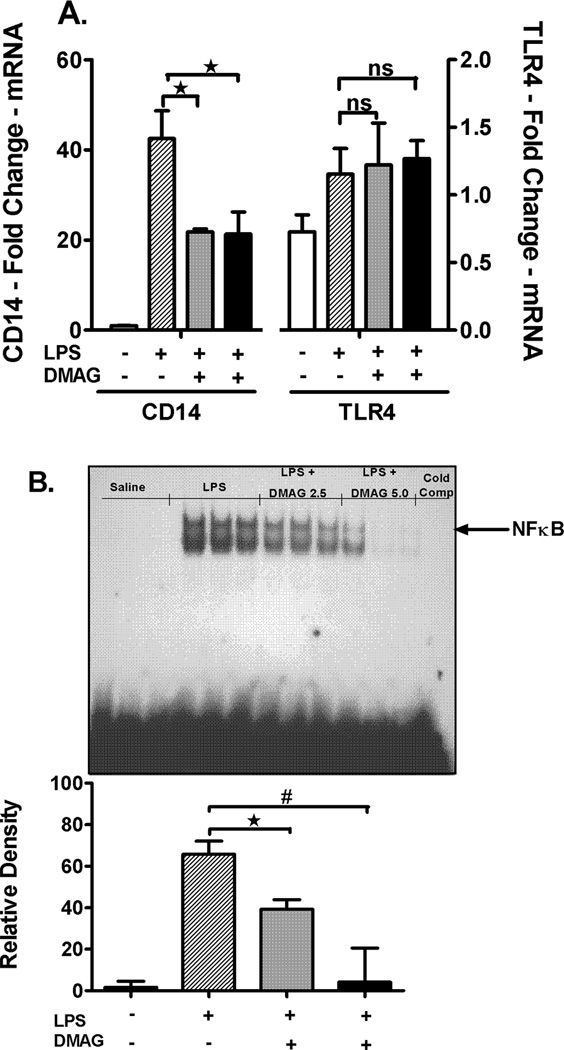 0.5 mg/kg BW) and 17-DMAG ( 2.5 and 5 mg/kg BW) and livers were collected at end of 2 hrs. NFκB DNA binding activity was detected in nuclear extracts of whole livers by EMSA using a 32P labeled, double stranded NFκB consensus oligonucleotide. A representative EMSA picture is shown in upper panel and the bar graph in lower panel shows mean relative density ± SEM (5 mice per group). #p<0.001, *p < 0.05 compared to LPS injected mice. Cytoplasmic IκBα (C), cellular NFκB p65 (D) and nuclear NFκB phospho p65 (E) were detected in livers collected at end of 2 hrs. A representative western blot picture is shown in upper panel and the bar graph in lower panel shows mean relative density ± SEM (5 mice per group). *p < 0.05 vs. LPS injected mice. ns-not significant.
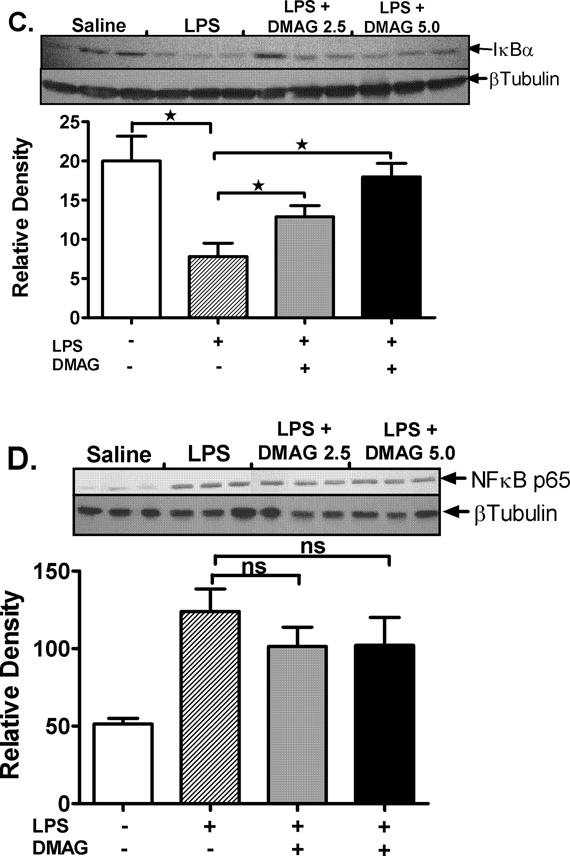 0.5 mg/kg BW) and 17-DMAG ( 2.5 and 5 mg/kg BW) and livers were collected at end of 2 hrs. NFκB DNA binding activity was detected in nuclear extracts of whole livers by EMSA using a 32P labeled, double stranded NFκB consensus oligonucleotide. A representative EMSA picture is shown in upper panel and the bar graph in lower panel shows mean relative density ± SEM (5 mice per group). #p<0.001, *p < 0.05 compared to LPS injected mice. Cytoplasmic IκBα (C), cellular NFκB p65 (D) and nuclear NFκB phospho p65 (E) were detected in livers collected at end of 2 hrs. A representative western blot picture is shown in upper panel and the bar graph in lower panel shows mean relative density ± SEM (5 mice per group). *p < 0.05 vs. LPS injected mice. ns-not significant.
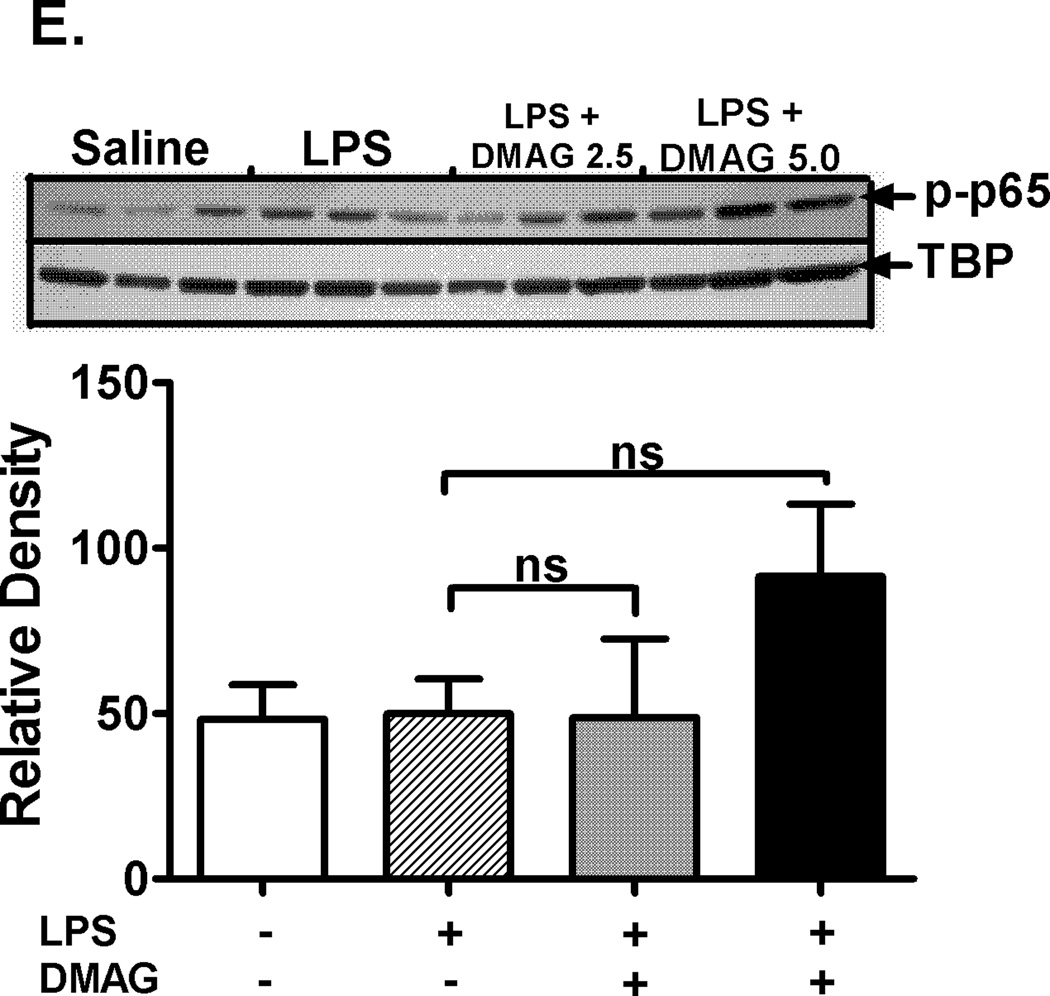 0.5 mg/kg BW) and 17-DMAG ( 2.5 and 5 mg/kg BW) and livers were collected at end of 2 hrs. NFκB DNA binding activity was detected in nuclear extracts of whole livers by EMSA using a 32P labeled, double stranded NFκB consensus oligonucleotide. A representative EMSA picture is shown in upper panel and the bar graph in lower panel shows mean relative density ± SEM (5 mice per group). #p<0.001, *p < 0.05 compared to LPS injected mice. Cytoplasmic IκBα (C), cellular NFκB p65 (D) and nuclear NFκB phospho p65 (E) were detected in livers collected at end of 2 hrs. A representative western blot picture is shown in upper panel and the bar graph in lower panel shows mean relative density ± SEM (5 mice per group). *p < 0.05 vs. LPS injected mice. ns-not significant.
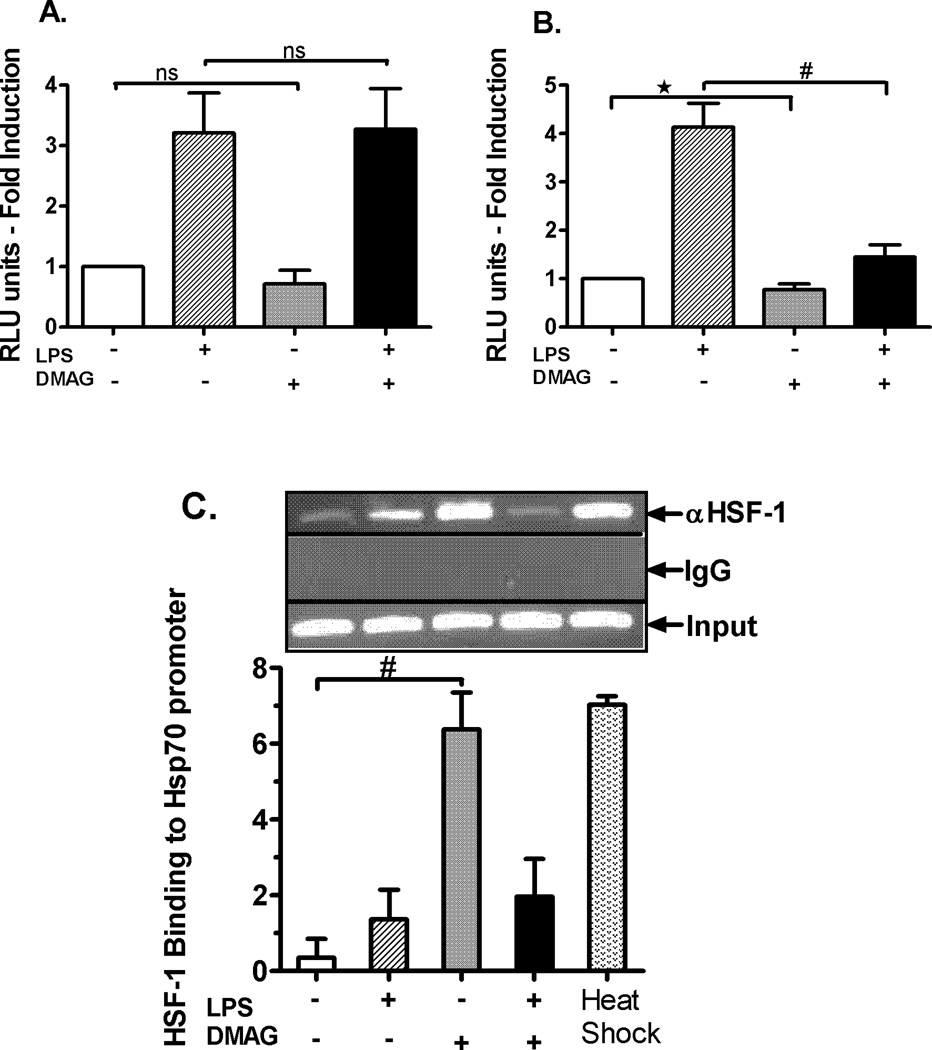 100 ng/ml), 17-DMAG ( 0.5 µM) or both () for 6 hrs. Fold induction in NFκB (A) and TNFα (B) promoter activity over unstimulated cells is shown as bar graph. *p < 0.05 vs. unstimulated cells, #p < 0.001 vs. LPS stimulated cells. Data represents mean of 3 experiments ± SEM. Chromatin immunoprecipitation assay was performed using anti-HSF1 antibody and semi quantitative PCR was carried out using hsp70 (C), TNFα (D), and IL-6 (E) promoter specific primers. A representative gel picture for each gene is shown. The densitometry graph represents average of 3 independent experiments. *p < 0.0001 vs. LPS stimulated cells; #p < 0.001 vs. unstimulated cells.
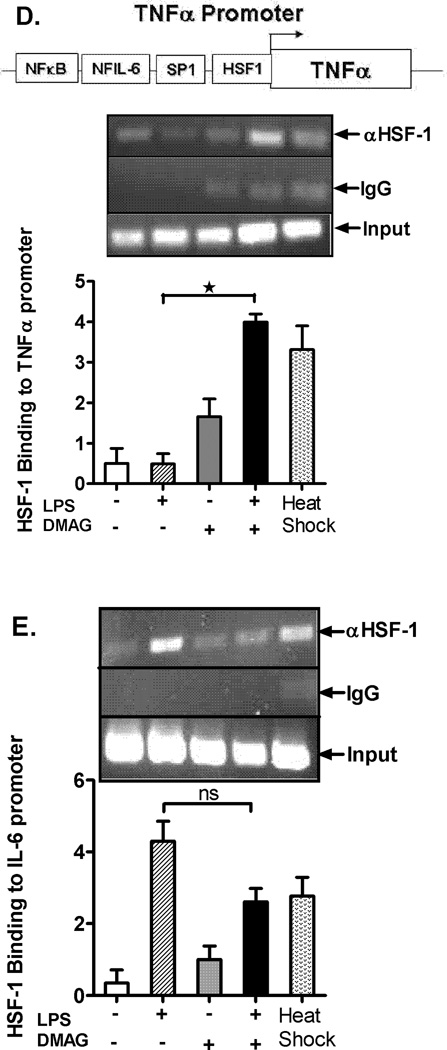 100 ng/ml), 17-DMAG ( 0.5 µM) or both () for 6 hrs. Fold induction in NFκB (A) and TNFα (B) promoter activity over unstimulated cells is shown as bar graph. *p < 0.05 vs. unstimulated cells, #p < 0.001 vs. LPS stimulated cells. Data represents mean of 3 experiments ± SEM. Chromatin immunoprecipitation assay was performed using anti-HSF1 antibody and semi quantitative PCR was carried out using hsp70 (C), TNFα (D), and IL-6 (E) promoter specific primers. A representative gel picture for each gene is shown. The densitometry graph represents average of 3 independent experiments. *p < 0.0001 vs. LPS stimulated cells; #p < 0.001 vs. unstimulated cells.
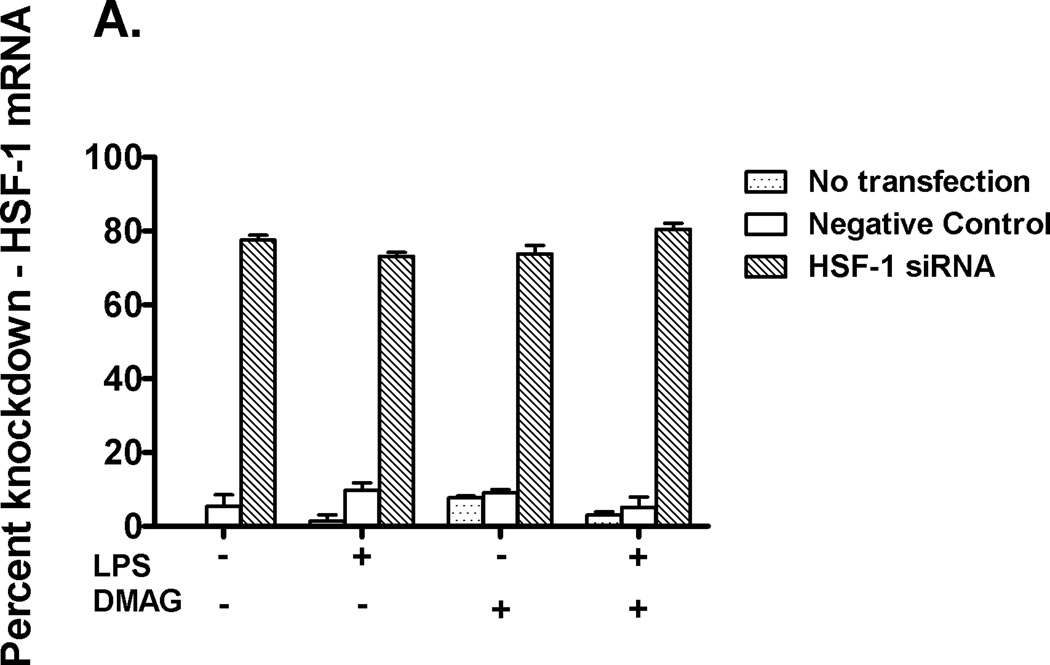
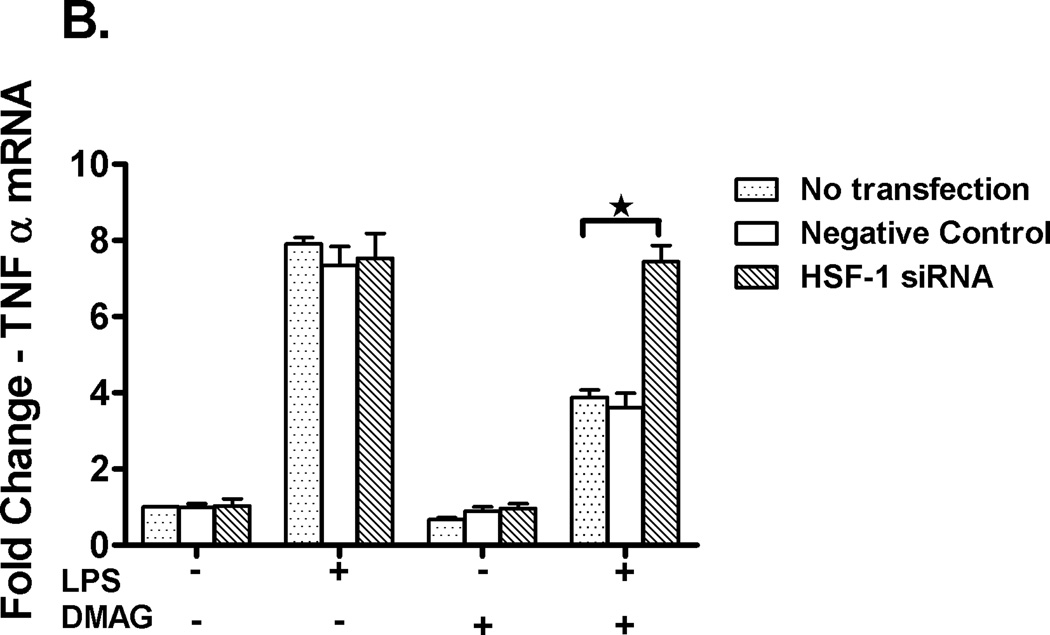
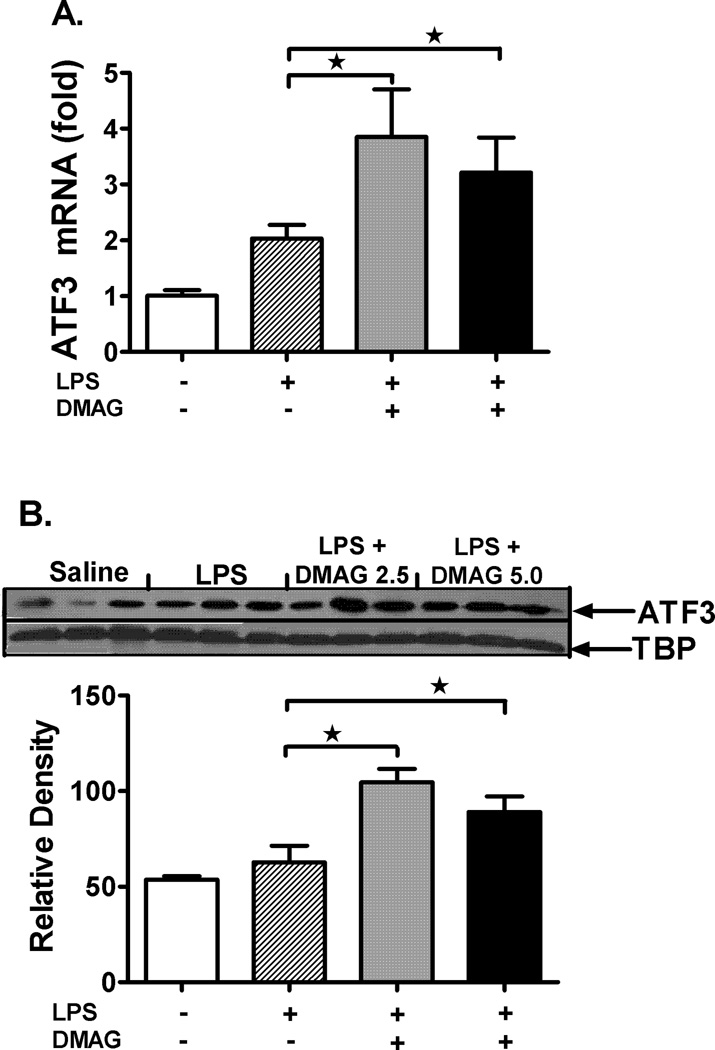 0.5 mg/kg BW) and 17-DMAG ( 2.5 and 5 mg/kg BW) and livers were collected at end of 2 hrs. Messenger RNA levels of liver ATF3 (A) were analyzed by quantitative real-time PCR, and normalized to 18S rRNA. Results are expressed as mean fold change ± SEM over mice injected with saline (5 mice per group). Nuclear ATF3 protein (B) was detected in livers collected at end of 2 hrs. A representative western blot picture is shown in upper panel and the bar graph in lower panel shows mean relative density ± SEM (5 mice per group). *p < 0.05 vs. LPS injected mice. RAW macrophages were transfected with HSF1 siRNA and were stimulated next day with LPS, 17-DMAG or both for 2 hrs. IL-6 mRNA was analyzed by real-time PCR. (C) Data represents mean fold change in IL-6 mRNA of 3 experiments ± SEM. #p < 0.001 vs. non transfected, LPS+17-DMAG stimulated cells.
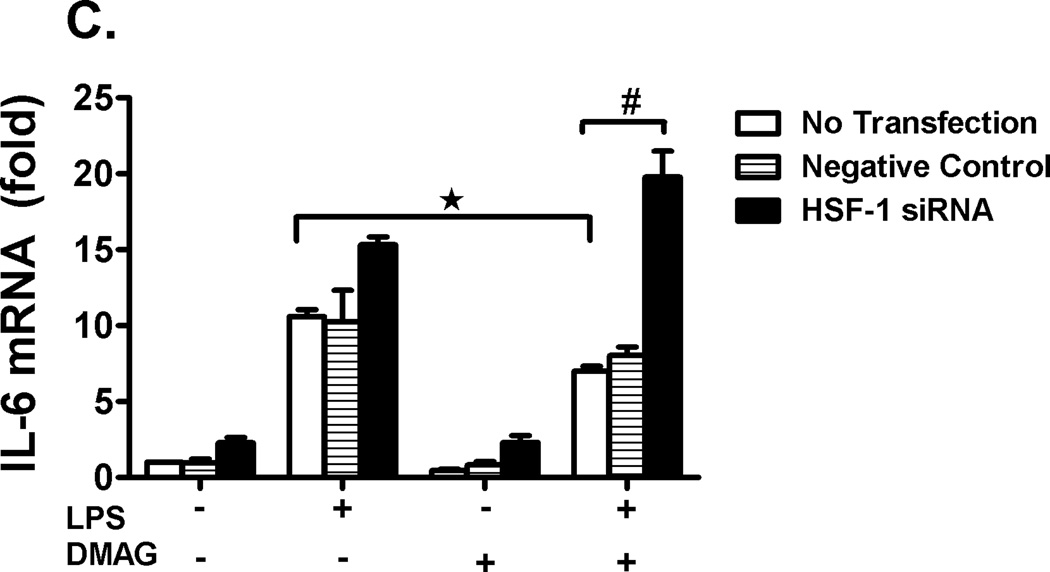 0.5 mg/kg BW) and 17-DMAG ( 2.5 and 5 mg/kg BW) and livers were collected at end of 2 hrs. Messenger RNA levels of liver ATF3 (A) were analyzed by quantitative real-time PCR, and normalized to 18S rRNA. Results are expressed as mean fold change ± SEM over mice injected with saline (5 mice per group). Nuclear ATF3 protein (B) was detected in livers collected at end of 2 hrs. A representative western blot picture is shown in upper panel and the bar graph in lower panel shows mean relative density ± SEM (5 mice per group). *p < 0.05 vs. LPS injected mice. RAW macrophages were transfected with HSF1 siRNA and were stimulated next day with LPS, 17-DMAG or both for 2 hrs. IL-6 mRNA was analyzed by real-time PCR. (C) Data represents mean fold change in IL-6 mRNA of 3 experiments ± SEM. #p < 0.001 vs. non transfected, LPS+17-DMAG stimulated cells.
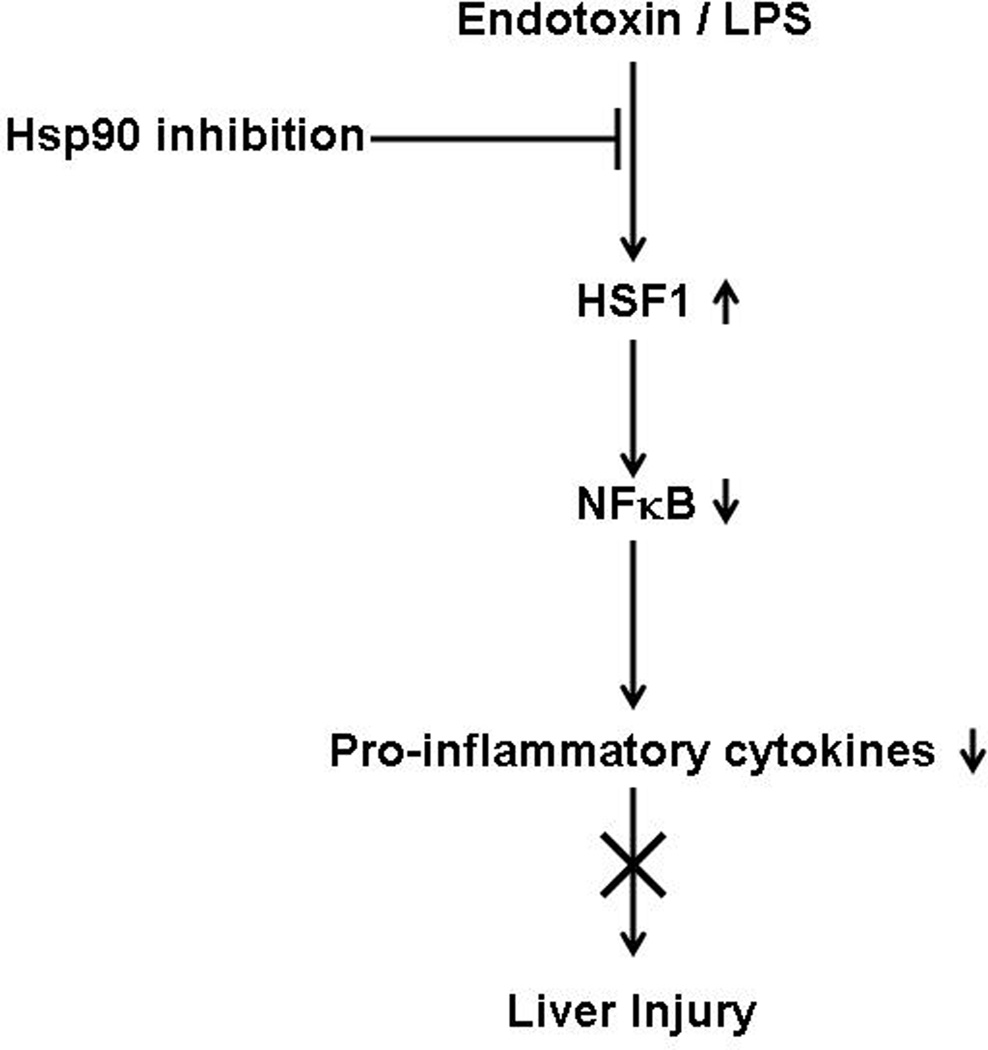
References
-
- Nolan JP. The role of intestinal endotoxin in liver injury: A long and evolving history. Hepatology. 2010;52(5):1829–1835. - PubMed
-
- Kudo H, Takahara T, Yata Y, Kawai K, Zhang W, Sugiyama T. Lipopolysaccharide triggered TNF-alpha-induced hepatocyte apoptosis in a murine non-alcoholic steatohepatitis model. J Hepatol. 2009;51(1):168–175. - PubMed
-
- Enomoto N, Ikejima K, Bradford BU, Rivera CA, Kono H, Goto M, Yamashina S, et al. Role of kupffer cells and gut-derived endotoxins in alcoholic liver injury. J Gastroenterol Hepatol. 2000;15(Suppl):D20–D25. - PubMed
-
- Uesugi T, Froh M, Arteel GE, Bradford BU, Wheeler MD, Gabele E, Isayama F, et al. Role of lipopolysaccharide-binding protein in early alcohol-induced liver injury in mice. J Immunol. 2002;168(6):2963–2969. - PubMed
Publication types
MeSH terms
Substances
Grants and funding
LinkOut - more resources
Full Text Sources
Medical