

Longer simulations sample larger subspaces of conformations while maintaining robust mechanisms of motion
- PMID: 22105881
- PMCID: PMC3290687
- DOI: 10.1002/prot.23225
Longer simulations sample larger subspaces of conformations while maintaining robust mechanisms of motion
Abstract
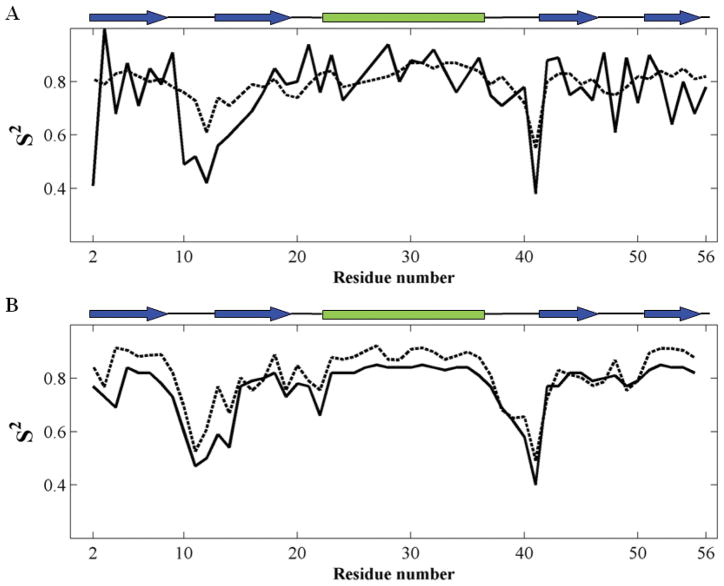
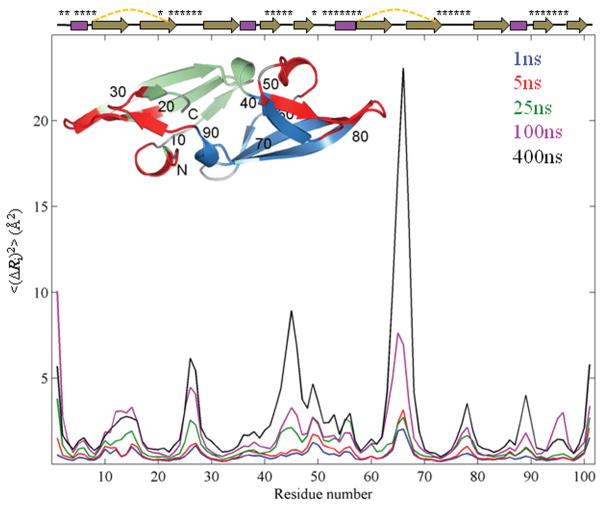
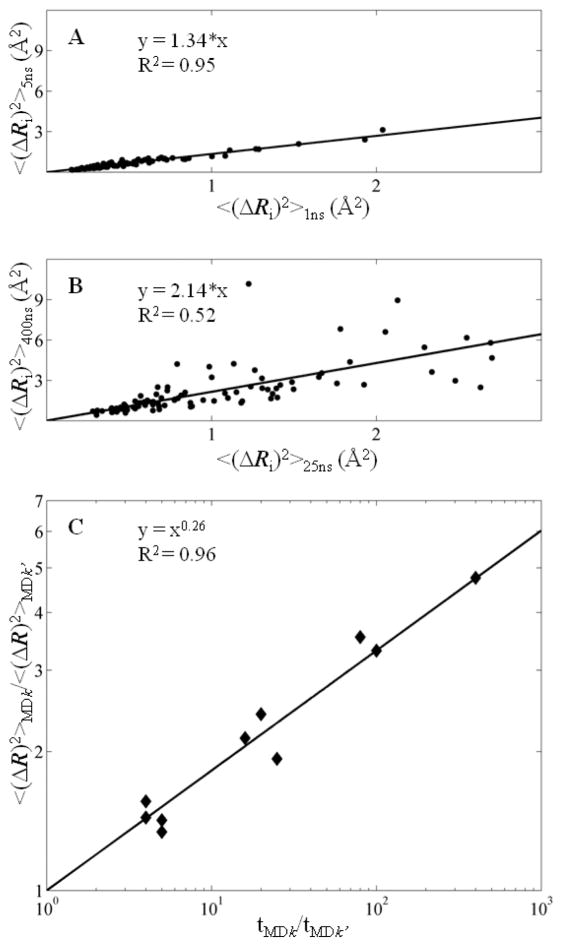
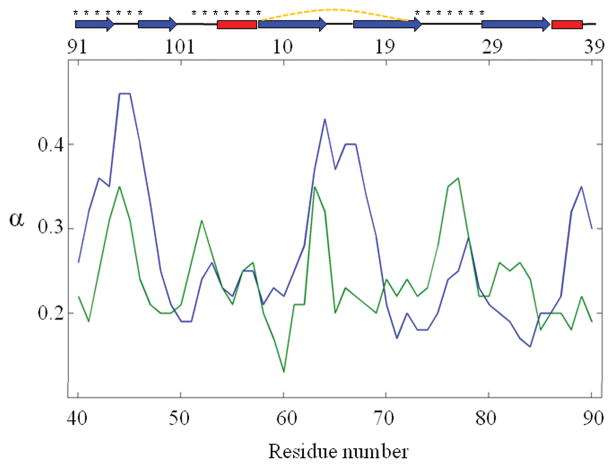
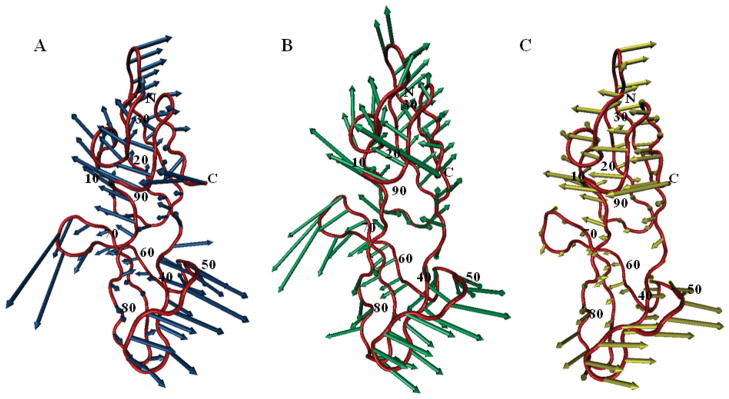
Recent studies suggest that protein motions observed in molecular simulations are related to biochemical activities, although the computed time scales do not necessarily match those of the experimentally observed processes. The molecular origin of this conflicting observation is explored here for a test protein, cyanovirin-N (CV-N), through a series of molecular dynamics simulations that span a time range of three orders of magnitude up to 0.4 μs. Strikingly, increasing the simulation time leads to an approximately uniform amplification of the motional sizes, while maintaining the same conformational mechanics. Residue fluctuations exhibit amplitudes of 1-2 Å in the nanosecond simulations, whereas their average sizes increase by a factor of 4-5 in the microsecond regime. The mean-square displacements averaged over all residues (y) exhibit a power law dependence of the form y ∝ x(0.26) on the simulation time (x). Essential dynamics analysis of the trajectories, on the other hand, demonstrates that CV-N has robust preferences to undergo specific types of motions that already can be detected at short simulation times, provided that multiple runs are performed and carefully analyzed.
Keywords: equilibrium fluctuations of cyanovirin-N; global motions; molecular dynamics simulations; power law; structure-encoded dynamics.
Copyright © 2011 Wiley Periodicals, Inc.
Figures
Similar articles
-
Effect of the Crystal Environment on Side-Chain Conformational Dynamics in Cyanovirin-N Investigated through Crystal and Solution Molecular Dynamics Simulations.PLoS One. 2017 Jan 20;12(1):e0170337. doi: 10.1371/journal.pone.0170337. eCollection 2017. PLoS One. 2017. PMID: 28107510 Free PMC article.
-
The Dynamics of the Neuropeptide Y Receptor Type 1 Investigated by Solid-State NMR and Molecular Dynamics Simulation.Molecules. 2020 Nov 24;25(23):5489. doi: 10.3390/molecules25235489. Molecules. 2020. PMID: 33255213 Free PMC article.
-
Locally accessible conformations of proteins: multiple molecular dynamics simulations of crambin.Protein Sci. 1998 Mar;7(3):649-66. doi: 10.1002/pro.5560070314. Protein Sci. 1998. PMID: 9541397 Free PMC article.
-
Molecular dynamics and NMR spin relaxation in proteins.Acc Chem Res. 2002 Jun;35(6):325-31. doi: 10.1021/ar010020l. Acc Chem Res. 2002. PMID: 12069616 Review.
-
Constraint methods that accelerate free-energy simulations of biomolecules.J Chem Phys. 2015 Dec 28;143(24):243143. doi: 10.1063/1.4936911. J Chem Phys. 2015. PMID: 26723628 Free PMC article. Review.
Cited by
-
Difference contact maps: From what to why in the analysis of the conformational flexibility of proteins.PLoS One. 2020 Mar 12;15(3):e0226702. doi: 10.1371/journal.pone.0226702. eCollection 2020. PLoS One. 2020. PMID: 32163442 Free PMC article.
-
Dynamic fluctuations provide the basis of a conformational switch mechanism in apo cyclic AMP receptor protein.PLoS Comput Biol. 2013;9(7):e1003141. doi: 10.1371/journal.pcbi.1003141. Epub 2013 Jul 18. PLoS Comput Biol. 2013. PMID: 23874183 Free PMC article.
-
Relative Contributions of Solubility and Mobility to the Stability of Amorphous Solid Dispersions of Poorly Soluble Drugs: A Molecular Dynamics Simulation Study.Pharmaceutics. 2018 Jul 21;10(3):101. doi: 10.3390/pharmaceutics10030101. Pharmaceutics. 2018. PMID: 30037083 Free PMC article.
-
Global motions exhibited by proteins in micro- to milliseconds simulations concur with anisotropic network model predictions.J Chem Phys. 2013 Sep 28;139(12):121912. doi: 10.1063/1.4816375. J Chem Phys. 2013. PMID: 24089724 Free PMC article.
-
Anomalous diffusion and dynamical correlation between the side chains and the main chain of proteins in their native state.Proc Natl Acad Sci U S A. 2012 Jun 26;109(26):10346-51. doi: 10.1073/pnas.1207083109. Epub 2012 Jun 11. Proc Natl Acad Sci U S A. 2012. PMID: 22689963 Free PMC article.
References
Publication types
MeSH terms
Substances
Grants and funding
LinkOut - more resources
Full Text Sources
Other Literature Sources
