. 2012 Jul 24;24(28):3823-30.
doi: 10.1002/adma.201103192. Epub 2011 Nov 22.

Nanoparticle shape improves delivery: rational coarse grain molecular dynamics (rCG-MD) of taxol in worm-like PEG-PCL micelles

Affiliations

Nanoparticle shape improves delivery: rational coarse grain molecular dynamics (rCG-MD) of taxol in worm-like PEG-PCL micelles

Sharon M Loverde et al. Adv Mater. .

Abstract

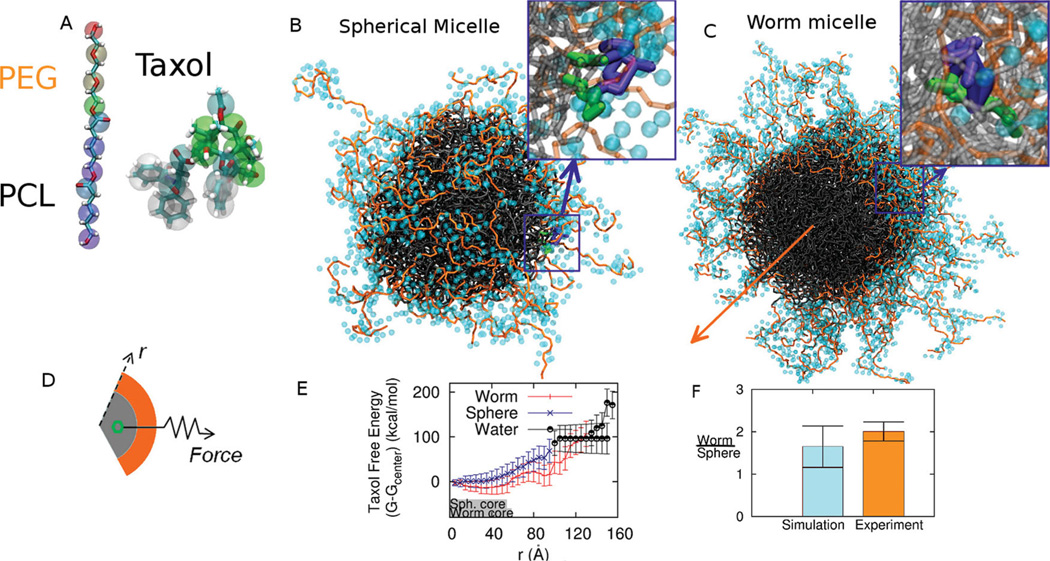
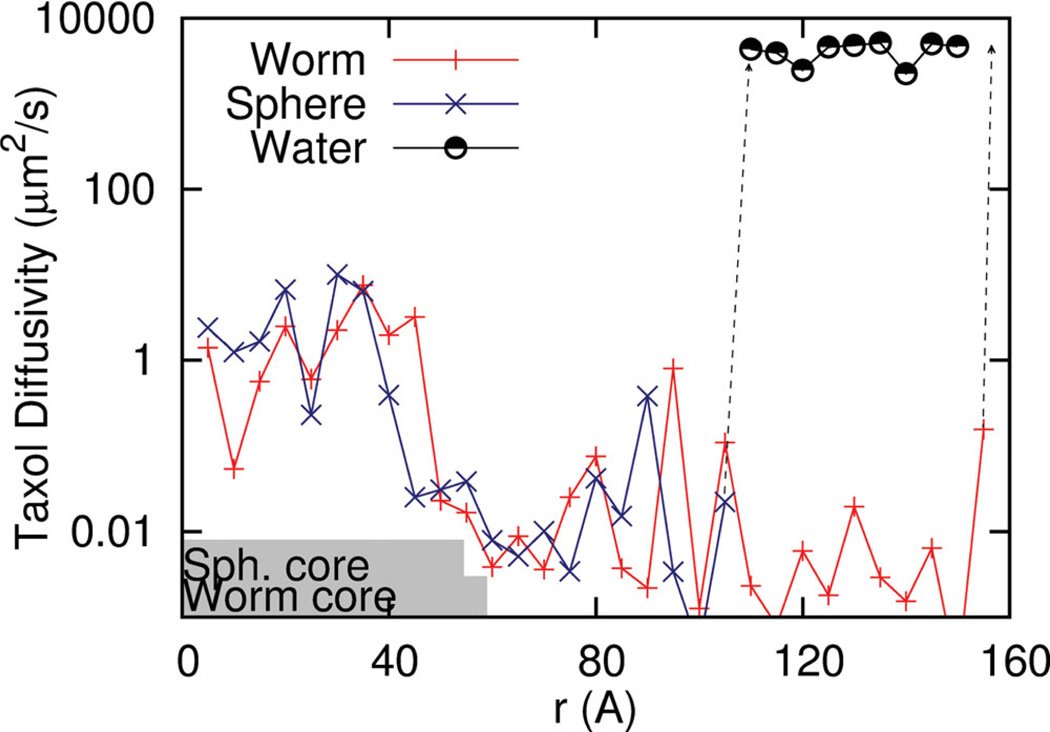
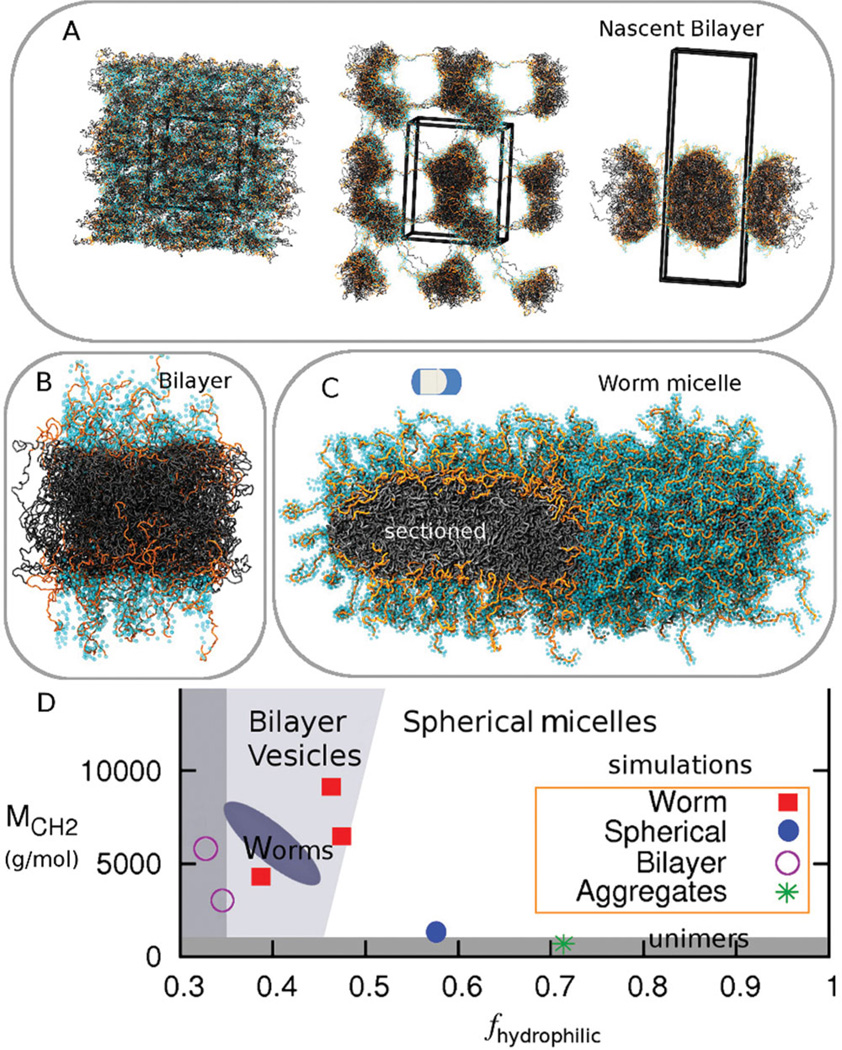
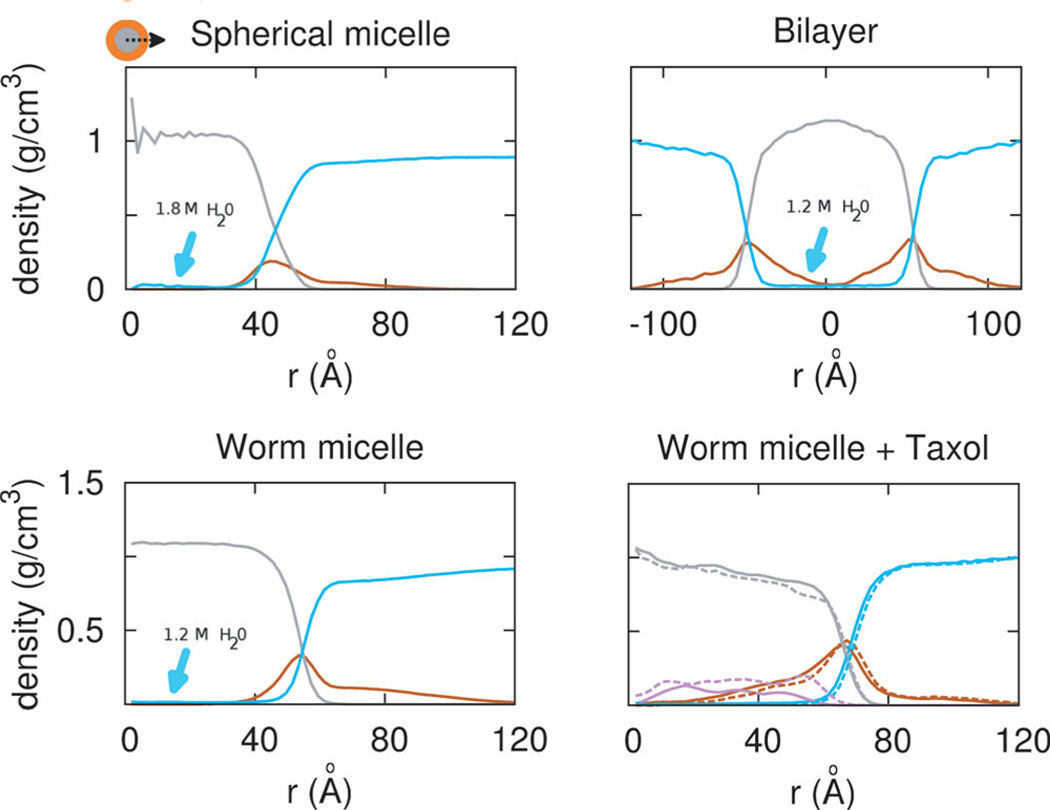
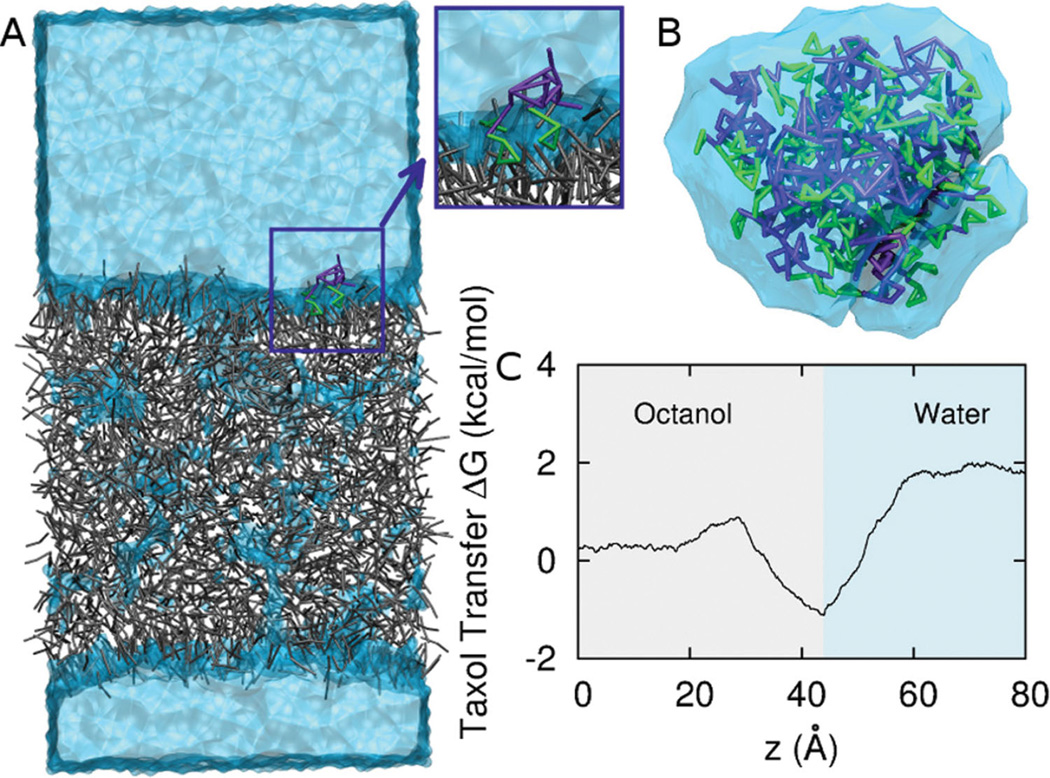
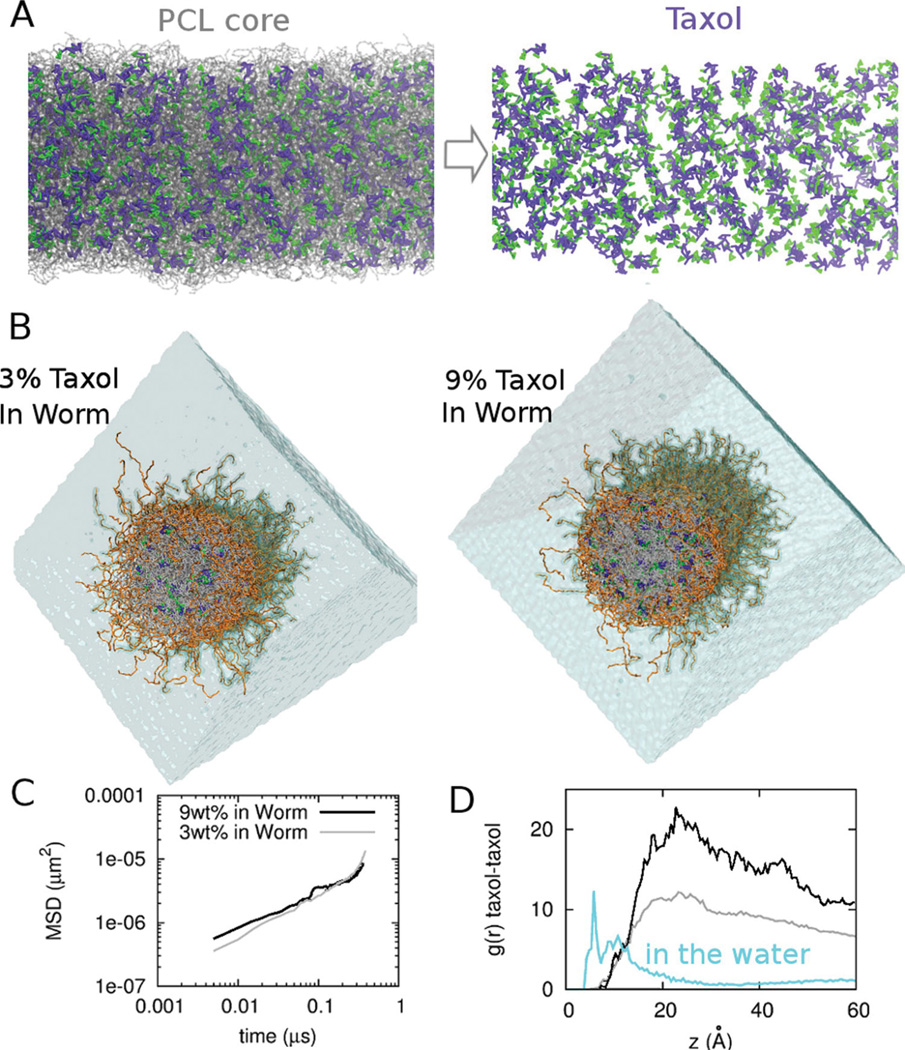
Nanoparticle shape can improve drug delivery, based in part on recent findings that flexible, worm-like nanocarriers (Worms) increase the amount of drug delivered to tumors and shrink the tumors more effectively than spherical micelles (Spheres). Here, all-atom molecular dynamics (MD) simulations are used to build a rational coarse grain (rCG) model that helps clarify shape-dependent effects in delivery of the widely used anticancer drug Taxol by block copolymer micelles. Potentials for rCG-MD were developed to examine the partitioning of this hydrophobic-aromatic drug into Worms and Spheres that self-assemble in water from poly(ethyleneglycol)-poly(caprolactone) (PEG-PCL), a weakly segregating amphiphile. PCL is a biodegradable, hydrophobic polymer widely used in biomaterials and accurately modeled here. Thermodynamic integration of the force to pull a single Taxol molecule from the micelles into solvent shows that twice as much drug loads into Worms than Spheres, fully consistent with experiments. Diffusivity of drug in the hydrated PEG corona is surprisingly slow compared to that in the core, indicative of strong but transient drug-polymer interactions. The distinctly distended corona of the Worms enhances such interactions and reflects the same balance of molecular forces that underlie an experimentally-validated phase diagram for simulated Spheres, Worms, and Bilayers. Moreover, with realistic drug loadings in micro-second simulations, Taxol is seen to draw PEG chains into the PCL core, dispersing the drug while localizing it near the interface—thus providing a molecular explanation for a measurable burst release of drug as well as the enhanced delivery seen with Worms.


Figures

Figure 1
Figure 1
Rational Coarse Grain Models of PEG-PCL and Taxol with Free Energy Calculations. A. Based on all-atom computations, the diblock copolymer is modeled with one CG bead per ethylene glycol monomer and three CG beads per caprolactone monomer plus one interfacial CG bead between the two blocks. Taxol’s CG model maps 3–5 heavy atoms into each CG bead. Supplemental Tables 1 and 2 provide mapping details. B, C. Spherical micelle and Worm micelle cross-section used for thermodynamic integration with Taxol constrained near the interface. The block copolymer is PEG2000–PCL5000,and PEG in orange is shown with its hydration layer of CG water. Taxol’s aromatic groups orient toward the core. The orange arrow indicates the symmetry axis of the worm micelle. D, E. Thermodynamic integration constrains Taxol at a radial position r from the center of mass of a micelle and measures the constraint Force vs r. The core dimensions of Sphere and Worm micelles at 0.05% PCL density are indicated schematically with gray bars, and the transition to water is taken at 0.01% PEG density, which is also close to the plateau density for bulk water. The change in Taxol free energy ΔG(r) is determined relative to the center of the micelle, although the minimum free energy for the Worm is close to the PEG-PCL interface. F. The partition coefficient for Taxol transferred into water from each micelle is calculated, and the partition ratio (Worm/ Sphere) agrees with experiments.
Figure 2
Figure 2
Taxol diffusivity derived from force auto-correlation function (FACF) analysis of drug pulled from the center of mass of the micelle into water. Core dimensions of Sphere and Worm micelles down to 0.05% PCL density are indicated with gray bars. The transition to water is indicated by a dashed line and shows the expected rapid increase in drug diffusivity. Between the core and water, Taxol interacts strongly with the PEG corona, which impedes diffusion.
Figure 3
Figure 3
Coarse Grain self-assembly of PEG-PCL with comparison to experimental phase diagram. A. Homogeneous dispersion of PEG1000–PCL3000 that assembles into a Bilayer. PEG is orange with cyan CG water forming a hydration layer (≤ 5 Å). Fluctuations in the random mixture are followed by segregation with extensive polymer entanglements in the periodic box, and then formation of a bicelle-like frustrated bilayer (at 30 ns). B, C. Bilayer of PEG2000–PCL7700,and Worm of PEG2000–PCL5000 are both stable morphologies. D. Phase diagram for CG simulations fit within a recent experimental phase diagram of the dominant phases.
Figure 4
Figure 4
Morphology dependent density profiles. (from left to right, top to bottom) Sphere of PEG2000–PCL5000,Worm of PEG2000–PCL5000 without and with taxol, and Bilayer of PEG2000–PCL7700. Water (cyan) penetrates into the core of the Sphere moreso than other morphologies. Worm and Bilayer morphology possess a denser PEG corona (orange) at 0.4 g/cm3 than the Sphere. Density in the core (grey) approaches that of a bulk melt of PCL, 1.2 g/cm3. With 3 or 9 wt% Taxol, PEG shifts into the core, and core density decreases. Increasing drug load shifts drug towards the interface.
Figure 5
Figure 5
Taxol in bulk water and at the Octanol water interface. A. Steered molecular dynamics of drug across a CG octanol-water interface. Octanol is grey, CG water is light blue, and Taxol is purple and green (benzene groups). B. Taxol aggregates in CG water in tens of nsec due to hydrophobicity. C. ΔG vs. z across the octanol-water interface. Interfacial adsorption near z = 40 Å is followed by an increase in free energy in the water phase with a net change of 1.9 kcal/mol.
Figure 6
Figure 6
Taxol dispersion at realistic drug concentrations within a Worm micelle. A. CG Taxol at 9 wt% in a PEG2000–PCL5000 Worm micelle core, with Taxol in purple and green and PCL chains as transparent grey. B. CG Taxol at 3 wt% loading (left) and 9 wt% loading (right), with the Worm’s end-cap removed to reveal the radial distribution of Taxol. C. Mean-squared displacement (MSD) of Taxol diffusing over 0.5 ms in 3 wt% and 9 wt% loaded Worms. D. Radial distribution function g(r) for taxol-taxol interactions in bulk water, and in the two drug-loaded Worms.

References

    1. Peer D, Karp JM, Hong S, Farokhzad OC, Margalit R, Langer R. Nat. Nanotechnol. 2007;2:751. - PubMed
    1. Kwon G, Kataoka K. Adv. Drug Delivery Rev. 1995;16:295.
    1. De Brabander M, Geuens G, Nuydens R, Willebrords R, De Mey J. Proc. Natl. Acad. Sci. USA. 1981;78:5608. - PMC - PubMed
    1. Stone GW, Ellis SG, Cox DA, Hermiller J, O’Shaughnessy C, Mann JT, Turco M, Caputo R, Bergin P, Greenberg J, Popma JJ, Russell ME. N. Engl. J. Med. 2004;350:221. - PubMed
    1. Champion JA, Mitragotri S. Proc. Natl. Acad. Sci. USA. 2006;103:4930. - PMC - PubMed

Publication types

LinkOut - more resources